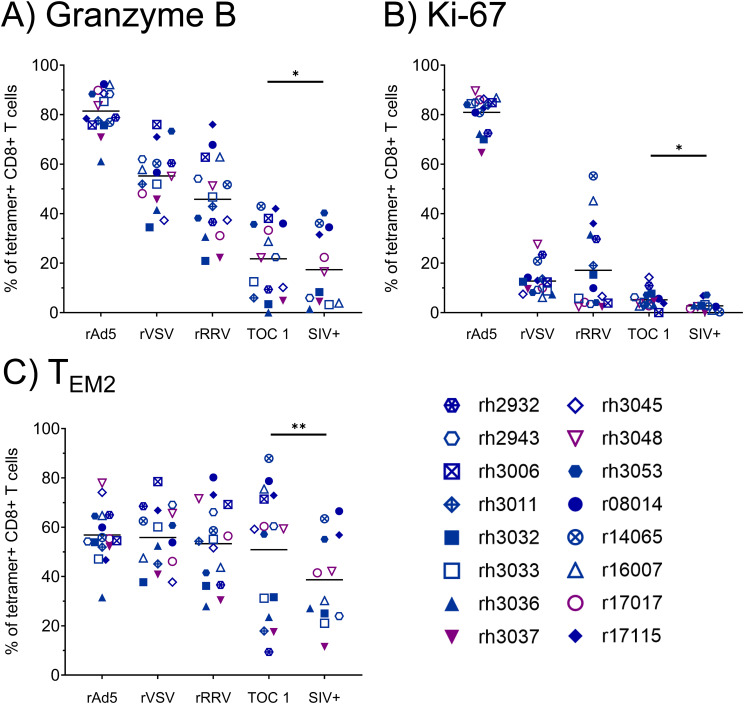
Figure 3.
Phenotypic characterization of vaccine-induced Nef RL10-specific CTLs during the vaccination phase. Vaccinee PBMCs were stained with fluorophore-conjugated Nef RL10-Mamu-B*08 tetramers and fluorophore-conjugated mAbs to assess the following CTL phenotypic characteristics: (A) frequencies of granzyme B+ CTLs, (B) frequencies of Ki-67+ CTLs, and (C) frequencies of terminally-differentiated effector memory (TEM2) CTLs, defined as CD28– CCR7– CTLs. PBMCs from the following timepoints were analyzed: two weeks post-rAd5 vaccination (“rAd5”), two weeks post-rVSV vaccination (“rVSV”), two weeks post-rRRV vaccination (“rRRV”), at the time of the first SIVmac239 challenge (“TOC 1”), and retrospectively at the time of the infecting challenge for a given animal (“SIV+”). Plots depict frequencies of Nef RL10-Mamu-B*08 tetramer+ CD8+ T cells (defined as live tetramer+ CD3+ CD8+ CD4– CD14– CD20– CD159a– lymphocytes) meeting the staining criteria for each phenotypic characteristic. Statistical significance testing was performed to assess differences in Nef RL10-specific CTL phenotypic characteristics across all timepoints (Friedman test) and to determine whether these phenotypic characteristics changed during the challenge phase (Wilcoxon test, comparing the “TOC 1” and “SIV+” timepoints). Friedman test P-values were < 0.0001, < 0.0001, and 0.02073 for panels (A-C) respectively. Wilcoxon test results are shown in each panel: *P < 0.05, **P < 0.01.

