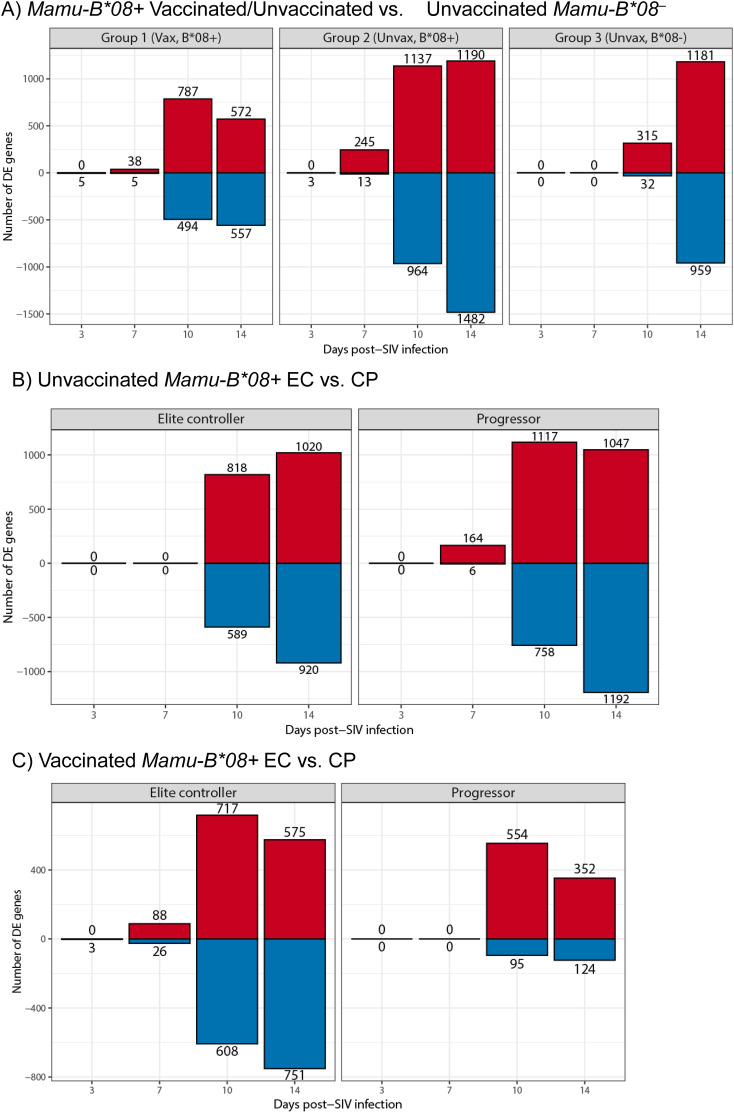
Figure 9.
Differential gene expression during acute SIVmac239 infection of RMs. Bar plots of differentially expressed genes relative to day 0 baseline (blood draw prior to SIVmac239 challenge later in day) in (A) vaccinated Mamu-B*08+ RMs, unvaccinated Mamu-B*08+ RMs, and unvaccinated Mamu-B*08– RMs, (B) unvaccinated Mamu-B*08+ ECs and CPs, and (C) vaccinated Mamu-B*08+ ECs and CPs. Red indicates upregulated genes; blue indicates downregulated genes.

