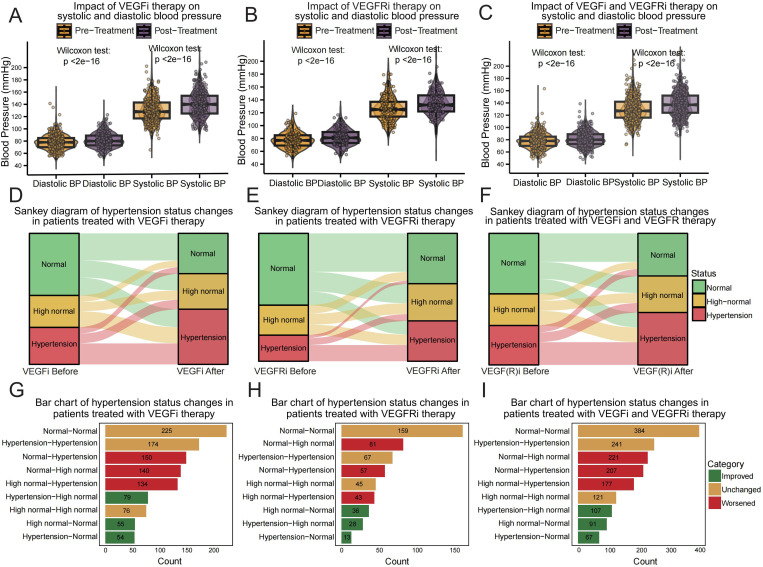
Figure 3.
Analysis of blood pressure in clinical patients using VEGFi and VEGFRi. (A) Comparative analysis of pre- and post-treatment blood pressure in VEGFi patients: This graph shows the impact on both diastolic and systolic blood pressure in patients receiving VEGFi therapy, highlighting significant increases post-treatment. (B) Blood pressure changes post-VEGFRi therapy: This graph displays comparative plots of diastolic and systolic blood pressure before and after VEGFRi treatment, documenting notable shifts towards higher pressures. (C) Overall impact on blood pressure by VEGFi or VEGFRi treatment: This graph summarizes the effects on diastolic and systolic blood pressure across the patient cohort treated with both inhibitors. (D) Transition dynamics in blood pressure status due to VEGFi: Sankey diagram illustrating shifts in blood pressure categories before and after treatment with VEGFi, visualizing both deterioration and improvements in patient statuses. (E) Blood pressure category shifts following VEGFRi administration: This Sankey plot details the changes in blood pressure status for patients treated with VEGFRi. (F) Combined effects of VEGFi or VEGFRi on blood pressure status: This Sankey plot summarizes the changes in blood pressure status across the patient cohort treated with both inhibitors. (G) Quantitative changes in blood pressure status in VEGFi-treated patients: Bar graph detailing the counts of patients across different hypertension status transitions post-VEGFi therapy. (H) Hypertension status changes post-VEGFRi treatment: Bar chart quantifies the transitions in blood pressure status for post-VEGFRi therapy. (I) The collective outcomes for patients treated with VEGF or VEGFR inhibitors: Bar chart detailing the predominant trends in hypertension status transitions with both inhibitors.

