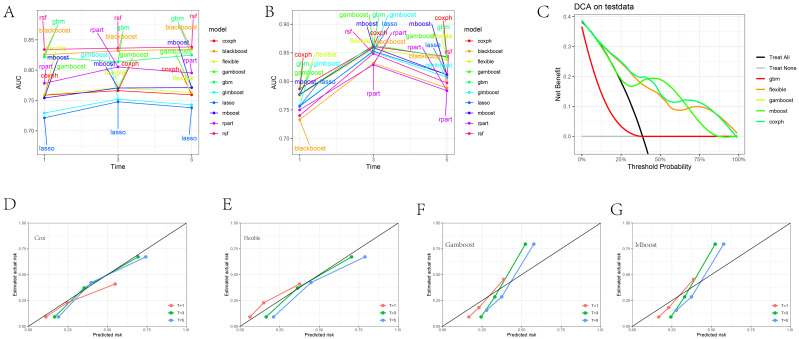
Figure 2.
Machine Learning Model Evaluation and Display. (A) AUC values of 10 different machine learning models at 1, 3, and 5-year specific time points in the training set. (B) AUC values of 10 different machine learning models at 1, 3, and 5-year specific time points in the test set. (C) DCA plot of selected machine model. (D–G) Calibration plot of CoxPH, Flexible, Gamboost, mboost machine model.

