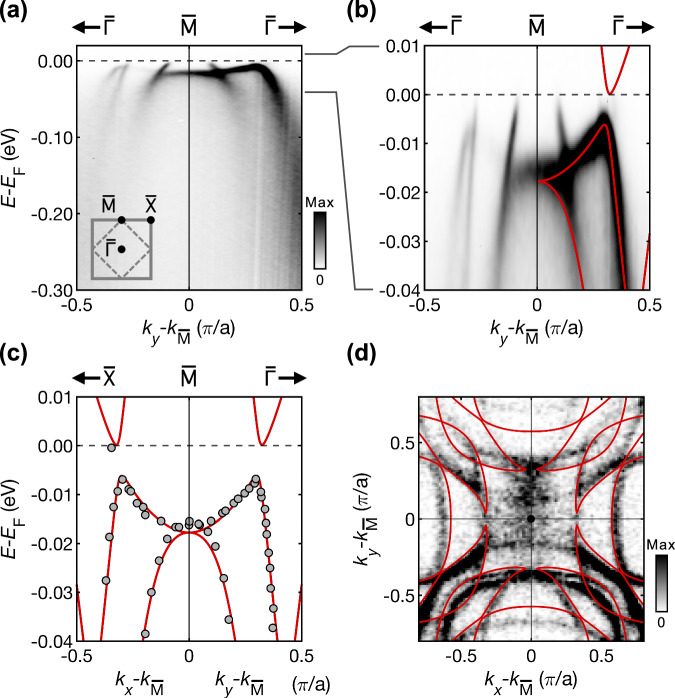
Fig. 3. Electronic structure from ARPES and fitting of the tight-binding model.
a Band dispersions of the bulk and surface electronic structure of Sr2RuO4 measured by ARPES along the direction of the surface BZ, reproduced from ref. 27. b Zoom-in of the measured electronic structure near EF, with the fitted tight-binding model shown atop (red lines, θ = 8.03°, λ = 0.17eV, and Z = 0.24). c The model is fitted to the bands extracted from the measurements shown in (b) and from additional measurements (ref. 27). d Corresponding Fermi surface measured by ARPES and calculated from our tight-binding model. The colour bars in (a) and (d) indicate the photoemission intensity in arbitrary units.

