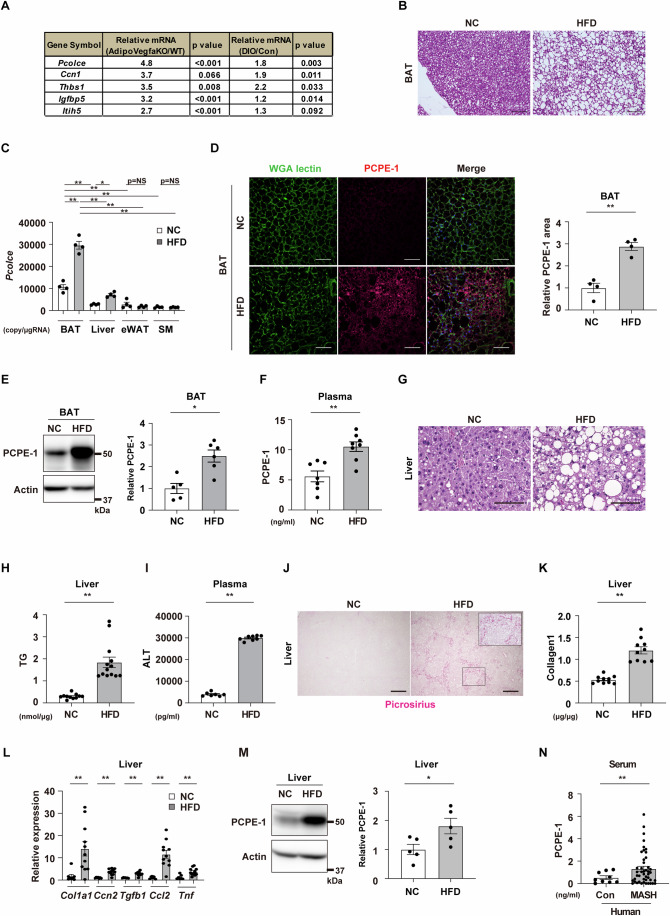
Figure 1. Exploration of BAT-derived adipokine in obesity.
(A) Results of DNA microarray datasets analyzing brown adipose tissue (BAT) from adipose tissue-specific Vegfa knockout mice (Adipo-Vegfa KO) (GSE221854) or high-fat diet (HFD) fed wild-type mice (diet-induced obesity (DIO)) (GSE28440). (B) C57BL/6NCrSlc mice were fed with a normal chow (NC) or a high-fat diet (HFD) from 4 weeks of age and studied at 34–38 weeks of age. Hematoxylin-eosin (HE) staining of BAT from indicated mice. Scale bar = 100 μm. (C) Copy number for the transcript Pcolce in BAT, liver, epididymal white adipose tissue (eWAT) and skeletal muscle (SM) (quadriceps) of the indicated mice (all n = 4). (D) Immunofluorescent staining for procollagen C-endopeptidase enhancer-1 (PCPE-1) in BAT of the indicated mice. Scale bar = 50 μm. The right panel indicates the quantification of the PCPE-1 positive area in BAT (n = 4, 4). (E) Western blot analysis of PCPE-1 expression in BAT from the indicated mice. The right panel indicates the quantification of PCPE-1 relative to Actin (n = 5, 6). (F) ELISA for PCPE-1 in plasma from the indicated mice (n = 7, 8). (G) HE staining of the liver from the indicated mice. Scale bar = 100 μm. (H, I) ELISA for liver triglyceride (TG) (n = 11, 13) (H) or plasma alanine transaminase (ALT) (n = 7, 8) (I) in the indicated mice. (J) Picrosirius red staining of liver from the indicated mice. Scale bar = 500 μm. The quantification results see Fig. EV1Q. (K) ELISA for liver collagen type I (Collagen1) in the indicated mice (n = 10, 10). (L) Results from quantitative PCR (qPCR) showing transcripts Col1a1 (n = 8, 11), Ccn2(Ctgf) (n = 7, 11), Tgfb1 (n = 7, 11), Ccl2 (n = 7, 11), and Tnf (n = 7, 11) in the liver from the indicated mice. (M) Western blot analysis of PCPE-1 expression in liver from the indicated mice. The right panel indicates the quantification of PCPE-1 relative to Actin (n = 5, 5). (N) ELISA for human PCPE-1 in serum from control (Con) or MASH patients (n = 10, 45). Except for (C), all data were analyzed by an independent-samples T-test. The data in (C) were analyzed by a two-way analysis of variance (ANOVA) followed by Tukey’s multiple comparison test. All data are from different biological replicates. In (N), analyses were performed including values categorized as outliers. Data information: Representative data of two independent series (C–E, L, M), one independent experiment analyzing samples from at least 2 independently prepared samples (F, H, I, K, N). *p < 0.05, **p < 0.01. Values represent the mean ± SEM. NS = not significant. Source data are available online for this figure.

