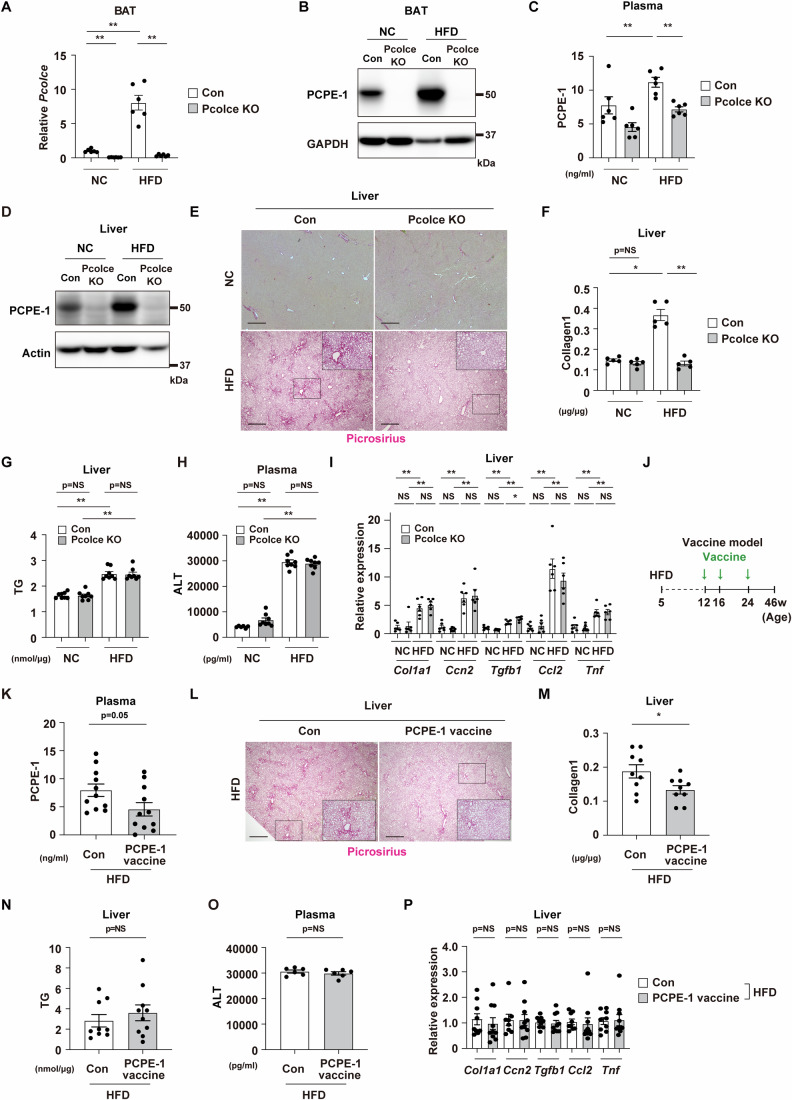
Figure 3. Models with systemic PCPE-1 inhibition ameliorate liver fibrosis.
Littermate control (Con) or systemic Pcolce KO mice were fed a normal chow (NC) or a high-fat diet (HFD) from 4 weeks of age and studied at 38–40 weeks of age. (A) Quantitative PCR (qPCR) results showing transcript Pcolce in BAT from indicated mice (n = 6, 6, 6, 6). (B–D) Western blot analysis for PCPE-1 in BAT (B) or liver (D), and ELISA showing plasma PCPE-1 (C) (n = 6, 6, 6, 6) from indicated mice. For the quantification of these Western blot results see Fig. EV3B or Fig. EV3E. (E) Picrosirius red staining of liver from the indicated mice. Scale bar = 500 μm. For the quantification results see Fig. EV3F. (F–H) ELISA for liver collagen type I (F) (n = 5, 5, 5, 5), liver triglyceride (TG) (G) (n = 8, 8, 8, 8), and plasma alanine transaminase (ALT) (H) (n = 6, 8, 8, 8) (G) in the indicated mice. (I) Results from qPCR showing transcript Col1a1, Ccn2(Ctgf), Tgfb1, Ccl2, and Tnf in liver from indicated mice (n = 6, 6, 6, 6). (J) Experimental design of a vaccination therapy targeting PCPE-1. C57BL/6NCrSlc mice were fed a HFD from 4 weeks of age. These mice were injected with a PCPE-1 vaccine at 12, 16, and 24 weeks of age (total of 3 injections), and studied at 46 weeks of age. (K) ELISA for plasma PCPE-1 in the indicated mice (n = 11, 11). (L) Picrosirius red staining of liver from the indicated mice. Scale bar = 500 μm. For the quantification results see Figure EV3L. (M–O) ELISA for liver collagen type I (M) (n = 9, 9), liver TG (N) (n = 9, 10), and plasma ALT (O) (n = 6, 6) in the indicated mice. (P) Results from qPCR showing transcripts Col1a1 (n = 9, 10), Ccn2(Ctgf) (n = 8, 10), Tgfb1 (n = 9, 10), Ccl2 (n = 9, 10) and Tnf (n = 9, 10) in liver from indicated mice. All data were analyzed by an independent-samples T-test. Data information: Representative data of two or more independent series (A, I), one independent series (P), one independent experiment analyzing samples from at least 2 independently prepared samples (C, F–H, K, M–O). *p < 0.05, **p < 0.01. Values represent the mean ± SEM. NS = not significant. All data are from different biological replicates. Source data are available online for this figure.

