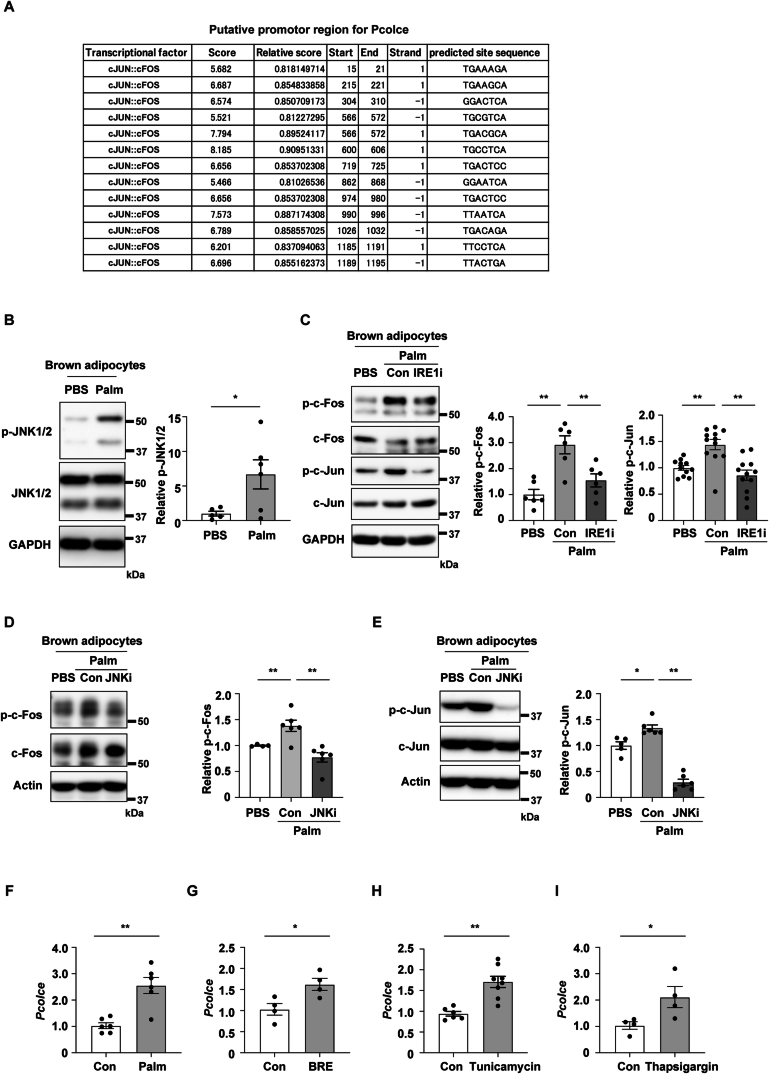
Figure EV4. Related to Fig. 4.
(A) Results of in silico analysis (DBTSS [http://dbtss.hgc.jp] and JASPAR [http://jaspar.binf.ku.dk]) predicting c-Fos and c-Jun may bind to putative promotor region of Pcolce. (B) Western blot analysis for phospho-JNK1/2 (p-JNK1/2) and JNK1/2 in fully differentiated brown adipocytes administrated with or without palmitic acid (Palm, 100 μM). The right panel indicates the quantification of p-JNK1/2 (n = 6, 6) relative to GAPDH. (C–E) Western blot analysis for p-c-Fos, c-Fos, p-c-Jun, and c-Jun in fully differentiated brown adipocytes administrated with PBS, palmitic acid (Palm; 100 μM for 6 h) with or without an IRE1 inhibitor (STF-083010, 30 μM, pre-treated 1 h) (C) or a JNK inhibitor (SP600125, 2 μM, pre-treated 1 h) (D, E). The right panels indicate the quantification of p-c-Fos and p-c-Jun relative to GAPDH or Actin (C: n = 6, 6, 6 for p-c-Fos, n = 11, 12, 12 for p-c-Jun) (D: n = 4, 6, 6) (E: n = 5,6,6). (F–I) Results from quantitative PCR (qPCR) showing transcript Pcolce in the differentiated brown adipocytes administrated with Palm (E) (n = 6, 6), BRE (Brefeldin A) (G) (n = 4, 4), Tunicamycin (H) (n = 6, 8) or Thapsigargin (I) (n = 4, 4). Data in Fig. EV4C–E were analyzed by a two-way analysis of variance (ANOVA) followed by Tukey’s multiple comparison test. Other data were analyzed by an independent-samples T-test. Data information: Representative data of two or more independent series (EV4B–I). *P < 0.05, **P < 0.01. NS = not significant. Values represent the mean ± SEM. All data are from different biological replicates. Source data are available online for this figure.

