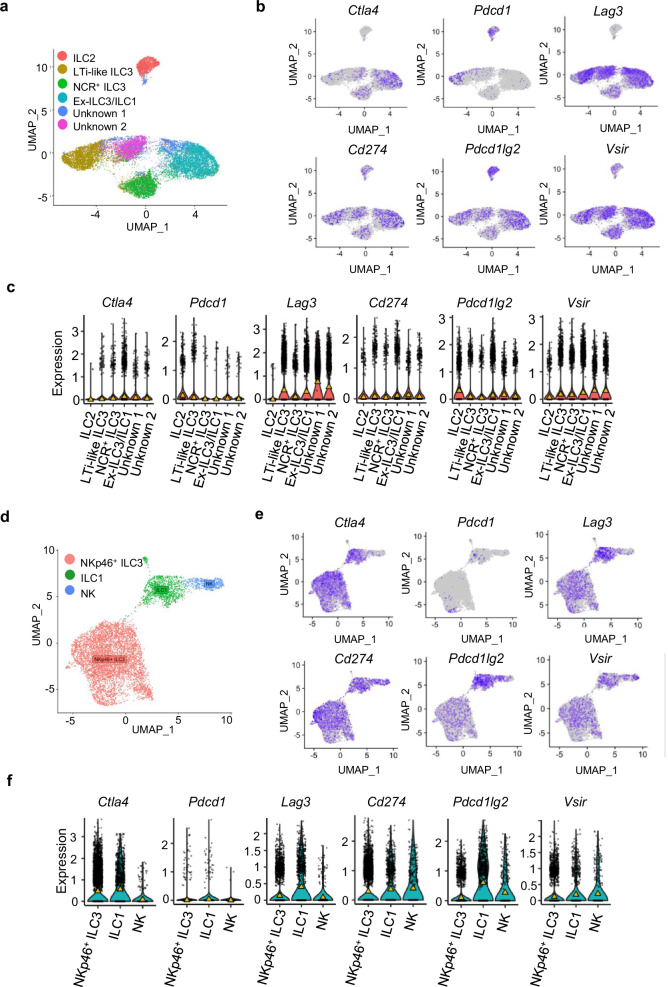
Fig. 1. The immune checkpoint transcriptional landscape across intestinal ILC clusters.
a UMAP plot showing the six ILC populations previously identified from CD45+ Lin− CD127+ sorted cells by Fiancette et al. b UMAP plots and (c) violin plots showing the expression of canonical immune checkpoint inhibitory molecules across the six identified ILC subsets (median shown by the yellow triangle). Cell counts for each clusters are: ILC2 1468, LTi-like ILC3 3736, NCR+ ILC3 2984, Ex-ILC3/ILC1 5241, Unknown (1) 1115 and Unknown (2) 2412 (d) UMAP plot showing the three populations of NKp46+ sorted cells previously identified by Krzywinska et al. e UMAP plots and (f) violin plots showing the expression of canonical immune checkpoint inhibitory molecules across the three identified ILC populations (median shown by the yellow triangle). Cell counts for the clusters identified here were: NKp46+ ILC3 5739, ILC1 1261 and NK 462.

