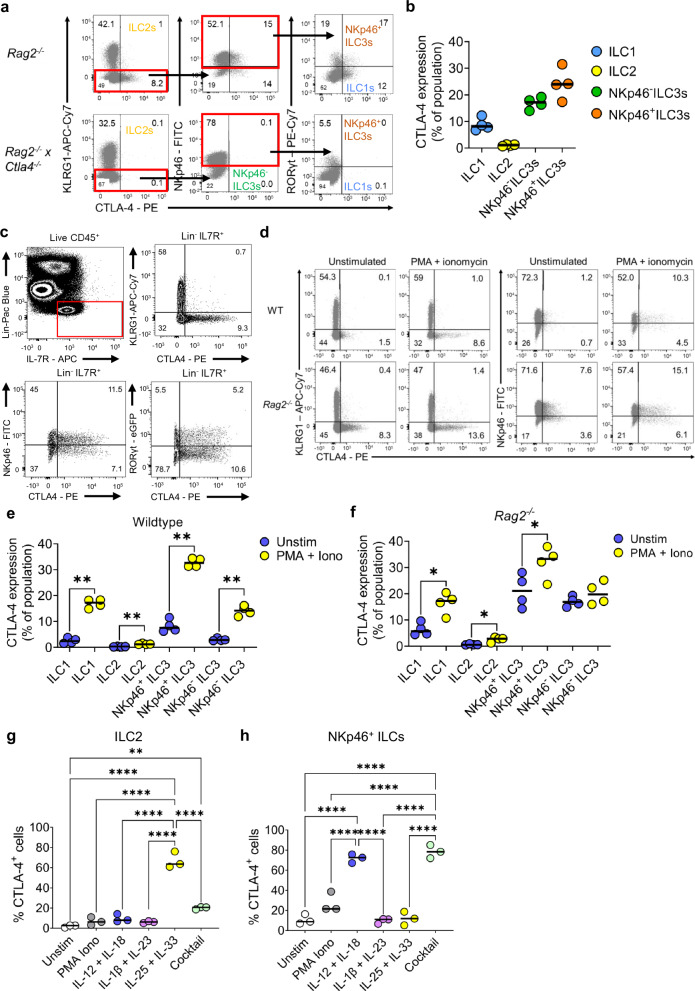
Fig. 2. CTLA-4 is present on ILC2s and NCR+ ILCs.
a Representative flow cytometry plots and (b) summary dot plots from BALB/c Rag2−/− (n = 4) and BALB/c Rag2−/− x Ctla4−/− mice (n = 4) showing the proportion of CTLA-4-expressing cLP ILC1, ILC2, NKp46+ ILC3s and NKp46- ILC3 cells. c Flow cytometry plot showing CTLA-4 in the lamina propria of the colon of BALB/c WT mice and C57BL/6 RORγt-eGFP mice. LPMC were stimulated with PMA, ionomycin and monensin for 4 h. d Representative flow cytometry plots and (e) summary dot plots from BALB/c WT mice (n = 4) and (f) BALB/c Rag2−/− mice (n = 4) showing the proportion of CTLA-4-positive KLRG1 and NKp46 ILC upon stimulation with PMA and ionomycin. Both e and f used RM one-way ANOVA test with Holm-Sidak’s multiple comparison, where * P = 0.0215 and ** P = 0.0033 (g) KLRG1+ (n = 3) and (h) NKp46+ KLRG1- cLP ILC (n = 3) were FACS sorted and cultured with OP9-DL1 for 48 hrs in the presence of rIL7, rIL2 and rIL-15 (unstim), with the addition of either PMA and ionomycin, rIL-12 and rIL-18, rIL-1β and rIL-23, rIL-25 and rIL-33, or rIL-12, rIL-18, rIL-1β, rIL-6, rIL-27 and rTGF-β (cocktail). The proportion of CTLA-4-positive KLRG1+ CD90.2+ and KLRG1- NKp46+ CD90.2+ cLP ILC was measured upon seeding KLRG1+ and KLRG1- cLP ILC, respectively. Both g and h used one-way ANOVA test with Holm-Sidak’s multiple comparison * P = 0.0111 ** P = 0.0015 **** P < 0.0001. All experimental n in Fig. 2 are biologically independent mouse samples.

