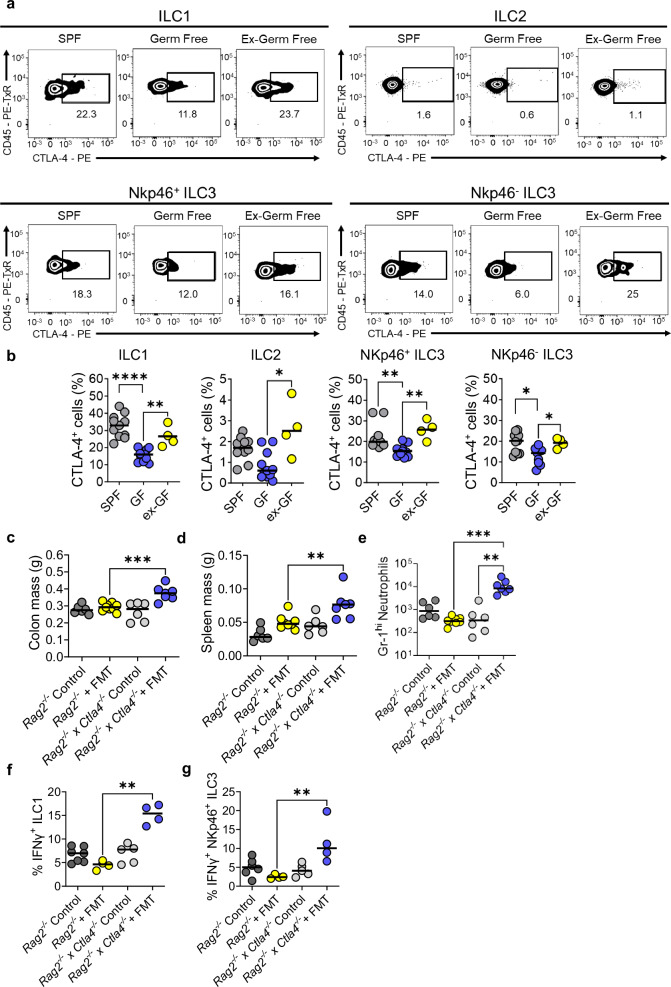
Fig. 3. ILC express CTLA-4 in a microbiota-dependent manner.
a Representative flow plots and (b) summary statistics showing the percentage of different ILC subsets (ILC1s, ILC2s, NCR+ ILC3s and NCR- ILC3s) that are positive for CTLA-4 in specific pathogen free (SPF) (n = 11), germ-free (GF) conditions (n = 11) and GF mice, which have been gavaged with SPF microbiota (ex-GF) (n = 4). One-sided Kruskal-Wallis Test with Dunn’s multiple comparison * P = 0.0106 ** P = 0.0048 **** P < 0.0001 (c) Colon, (d) spleen masses and (e) infiltrating Gr-1+ neutrophils between control BALB/c Rag2−/− (n = 6), FMT treated BALB/c Rag2−/− (n = 9), control BALB/c Rag2−/− x Ctla4−/− (n = 6) or FMT treated BALB/c Rag2−/− x Ctla4−/− (n = 7) ** P = 0.0037 *** P = 0.0007 One-sided Kruskal-Wallis Test. f IFNγ production from ILC1s (g) or NKp46+ ILC3s between control BALB/c Rag2−/− (n = 7), FMT treated BALB/c Rag2−/−(n = 4), control BALB/c Rag2−/− x Ctla4−/− (n = 5) or FMT treated BALB/c Rag2−/− x Ctla4−/− (n = 4) upon restimulation with PMA and ionomycin for 3 h. ** P = 0.0039 for f and P = 0.0052 for g using one-sided Kruskal-Wallis Test with Dunn’s multiple comparison. All experimental n in Fig. 3 are biologically independent mouse samples.

