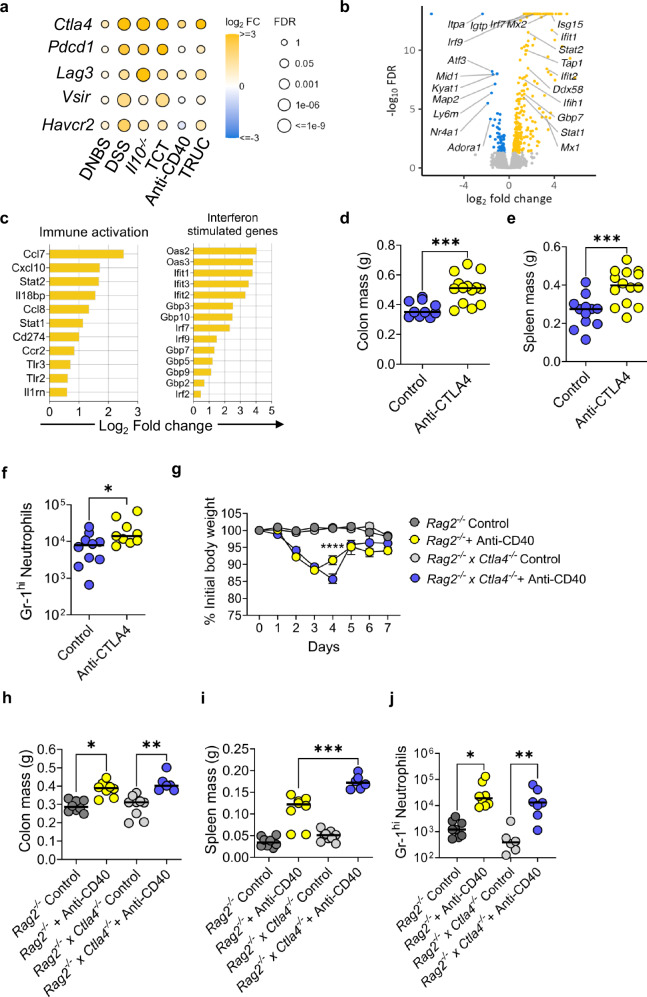
Fig. 4. CTLA-4 restrains innate immune activation in colitis.
a Heatmap of the changes in immune checkpoint expression in distal colon segments taken from different models of colitis (Il10−/− (n = 3), DSS (n = 4), T cell transfer (n = 4), DNBS (n = 4), TRUC (n = 4) and anti-CD40 (n = 4)) compared to control mice (controls were: WT mice (n = 4) for Il10−/−, DSS and DNBS models; Rag2−/− mice (n = 4) for T cell transfer, TRUC and anti-CD40 models. b Volcano plot showing the gene expression profile of distal colon segments taken from BALB/c Rag2−/− x Ctla4−/− mice (n = 4) compared to BALB/c Rag2−/− mice (n = 4). Positive log2 fold-changes indicate upregulation in Rag2−/− x Ctla4−/− mice, while negative log2 fold-changes indicate upregulation in Rag2−/− mice. c The most significantly upregulated differentially expressed genes involved in immune activation and interferon-stimulated genes from colon segments taken from Rag2−/− x Ctla4−/− mice (n = 4) compared to Rag2−/− mice (n = 4). d Colon mass, (e) spleen mass and (f) infiltrating Gr-1+ neutrophils between TRUC untreated mice (control) (n = 12) compared to TRUC mice treated with anti-CTLA-4 (n = 14) * P = 0.035 *** P = 0.0005 Two-tailed Mann Whitney U test. g weight change (with SEM) P < 0.0001 2-way ANOVA Test performed, (h) colon mass, (i) spleen mass and (j) infiltrating Gr-1+ neutrophils between control untreated BALB/c Rag2−/− mice (n = 8), BALB/c Rag2−/− mice treated with anti-CD40 (n = 8), untreated BALB/c Rag2−/− x Ctla4−/− mice (n = 9 for (h and i), n = 6 for (j) and BALB/c Rag2−/− x Ctla4−/− mice treated with anti-CD40 (n = 6 for (h and i,) n = 7 for (j) * P = 0.0165 ** P = 0.0036 *** P = 0.0005 One-sided Kruskal-Wallis Test with Dunn’s multiple comparison. All experimental n in Fig. 4 are biologically independent mouse samples.

