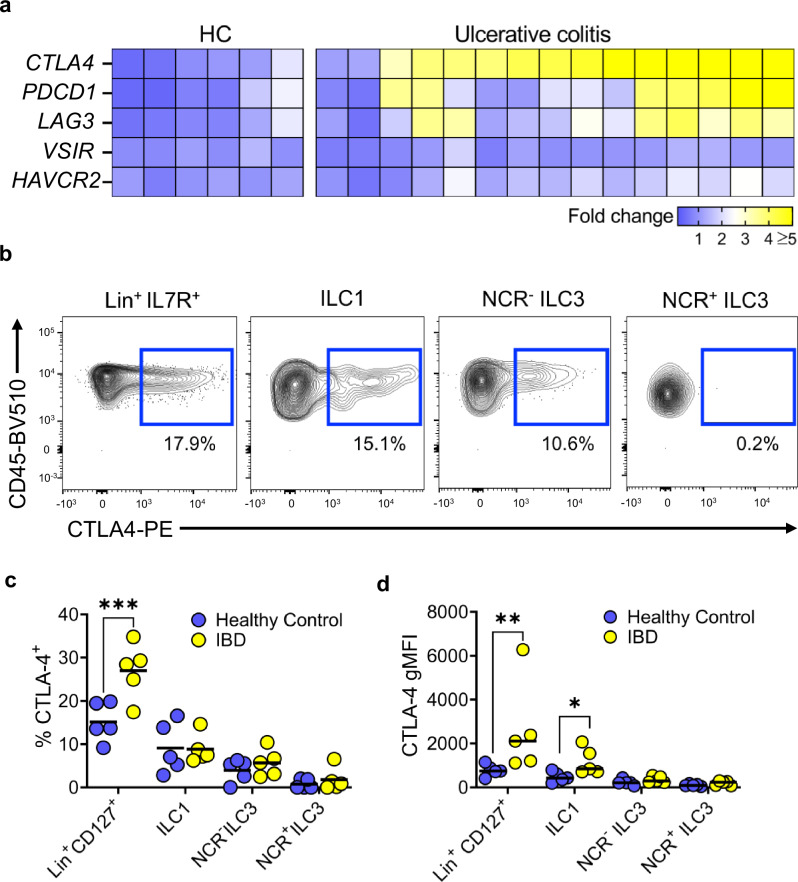
Fig. 5. CTLA-4+ ILC1 are present in IBD patients.
a Heatmap showing immune checkpoint molecule expression in the sigmoid colon of healthy patients (HC) (n = 6) and patients with ulcerative colitis (n = 15). b Representative flow plots and (c) summary statistics showing the percentage of different ILC subsets (ILC1s, NCR+ ILC3s and NCR- ILC3s) from patients with IBD (n = 5) and healthy controls (n = 5) that were positive for CTLA-4 after treatment with PMA, ionomycin and monensin for 3 h. *** P = 0.0002 2-way ANOVA with Šídák’s multiple comparisons Test. Lineage+ IL-7R+ shown as a positive control for CTLA-4 staining on bulk T cells. d Dot plot showing the CTLA-4 gMFI in different ILC subsets (ILC1, NCR+ ILC3 and NCR- ILC3) in patients with IBD (n = 5) compared with healthy controls (n = 5) * P = 0.0423 ** P = 0.0036 2-way ANOVA with Šídák’s multiple comparisons Test. All experimental n in Fig. 5 are biological independent human samples.

