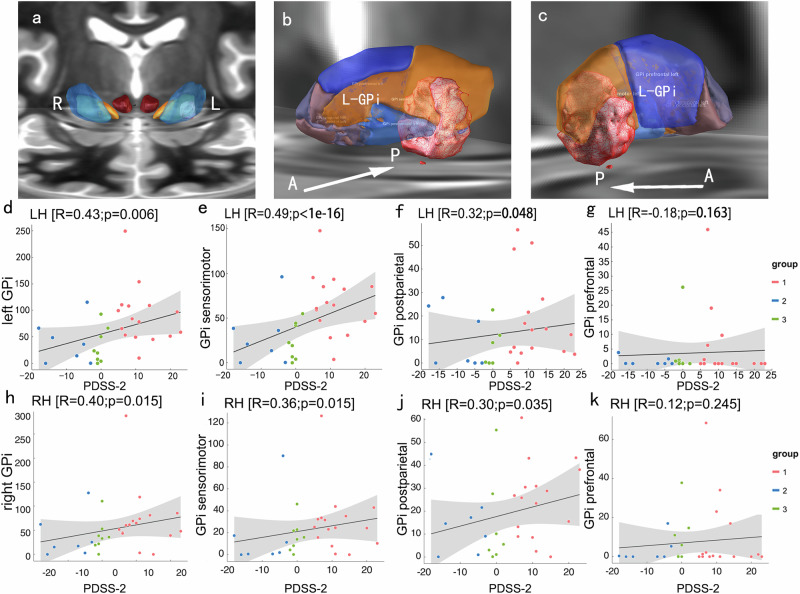
Fig. 4. 3D illustration of the sweetspot, shown in red indicated voxels correlated to improved PDSS-2.
a Anterior view of sweetspot analysis. Sweetspot voxels were distributed in the left hemisphere only, which were mostly overlapped with the left globus pallidus internus (GPi). b Anterior view of the sweetspot in the left GPi. The GPi was subdivided into sensorimotor (orange), postparietal (blue), prefrontal (dark blue), temporal (pink), and occipital (violet). c lateral and posterior view of the sweetspot. d‒g Individual PDSS-2 scores regressed to the intersection volume of the abovementioned subregions of the left GPi (d left GPi, e left sensorimotor GPi, f left postparietal GPi, g left prefrontal GPi). h‒k Individual PDSS-2 scores regressed to the intersection volume of the abovementioned subregions of the right GPi (h right GPi, e right sensorimotor GPi, f right postparietal GPi, g right prefrontal GPi). Group 1 represents patients with improved PDSS-2 scores, Group 2 represents patients with worsened PDSS-2 scores, Group 3 represents patients with a negligible change in PDSS-2 scores. LH: left hemisphere; RH: right hemisphere.

