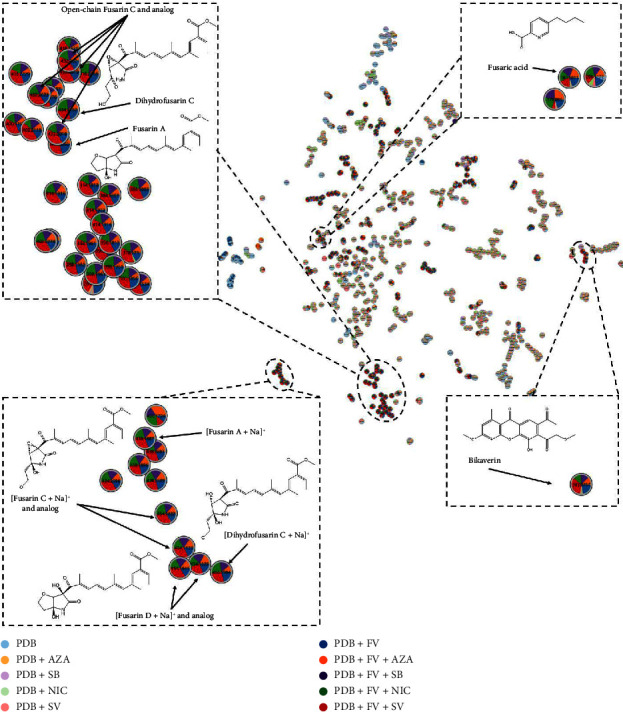
Figure 5.

Visualization of the t-SNE network corresponding to the extracts of F. verticillioides cultured in PDB alone or treated with AZA, SB, NIC, or SV for 14 days. Each node corresponds to a single feature defined by the m/z_Rt pair (normalized area).
