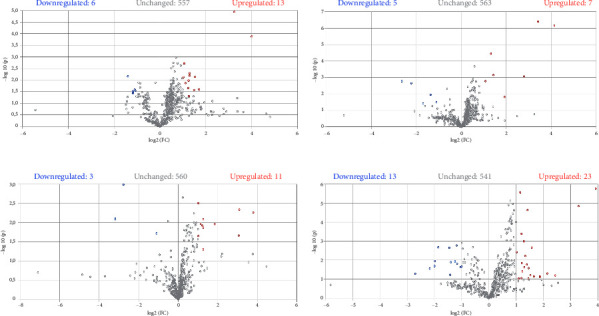
Figure 8.

Volcano plot representing the response of F. verticillioides to treatment with the different epigenetic modifiers: AZA (a), SB (b), NIC (c), and SV (d) compared with the control condition (PDB + FV). Each point represents a variable (m/z_Rt). Blue and red colors represent significant changes (p value <0.05 and fold-change ratio > 2) in the distribution of variables in the presence of epigenetic modifiers. Upregulated metabolites are shown in red, downregulated metabolites in blue, and unchanged metabolites in gray.
