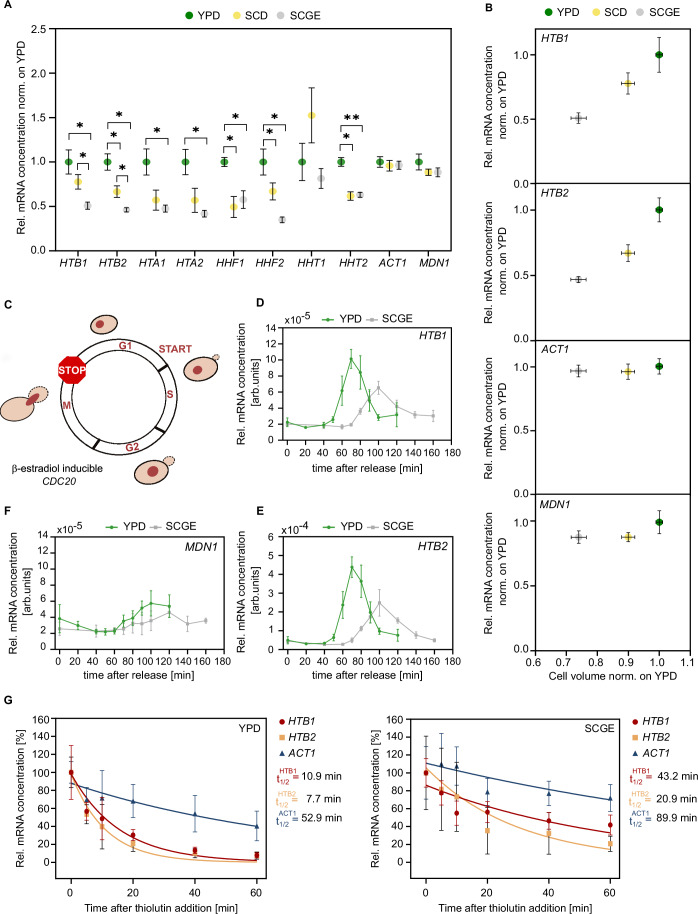
Figure 2. Histone transcription is downregulated in poor nutrients.
(A) RT-qPCR was used to quantify the mRNA concentrations of the core histone genes and the control genes ACT1 and MDN1 in different nutrient conditions. mRNA concentrations were normalized on RDN18 and are shown as mean fold changes compared to YPD. Error bars indicate standard errors of at least four independent biological replicates. Significances were determined by an unpaired, two-tailed t-test for datasets that follow a Gaussian distribution or a Mann–Whitney test for datasets that are not normally distributed; HTB1 (*pYPD-SCGE = 0.012, *pSCD-SCGE = 0.030); HTB2 (*pYPD-SCGE = 0.012, *pYPD-SCD = 0.026, *pSCD-SCGE = 0.034); HTA1 (*pYPD-SCGE = 0.030); HTA2 (*pYPD-SCGE = 0.034); HHF1 (*pYPD-SCGE = 0.015, *pYPD-SCD = 0.028); HHF2 (*pYPD-SCGE = 0.014, *pYPD-SCD = 0.034); HHT2 (**pYPD-SCGE = 0.0013, *pYPD-SCD = 0.028). (B) Relative mRNA concentrations of HTB1, HTB2, and ACT1 as a function of the relative nutrient-specific cell volume. The mean and standard error of at least four biological replicates are shown. (C) Cells carrying CDC20 under the control of a β-estradiol-inducible promoter were synchronized in mitosis. In the absence of β-estradiol, the expression of Cdc20 was turned off, preventing the cells from entering anaphase and exiting mitosis. (D–F) mRNA concentrations of HTB1, HTB2, and MDN1 (normalized to RDN18) were measured by RT-qPCR after synchronous release into the cell cycle (t = 0) triggered by the addition of 200 nM β-estradiol. Mean and standard deviation of four biological replicates are shown. (G) Transcription inhibition experiments suggest that histone mRNA stability increases in poor nutrient conditions. mRNA half-lives of HTB1, HTB2, and ACT1 were determined by adding the RNA polymerase inhibitor thiolutin to cells growing in different growth media and then measuring mRNA concentrations (normalized on RDN18) over time by RT-qPCR. Relative mRNA concentrations were normalized on the initial concentration at time = 0. For each time point, the mean and standard deviation of at least four biological replicates is plotted. Lines show single exponential fits to the individual data points of all replicates. Source data are available online for this figure.

