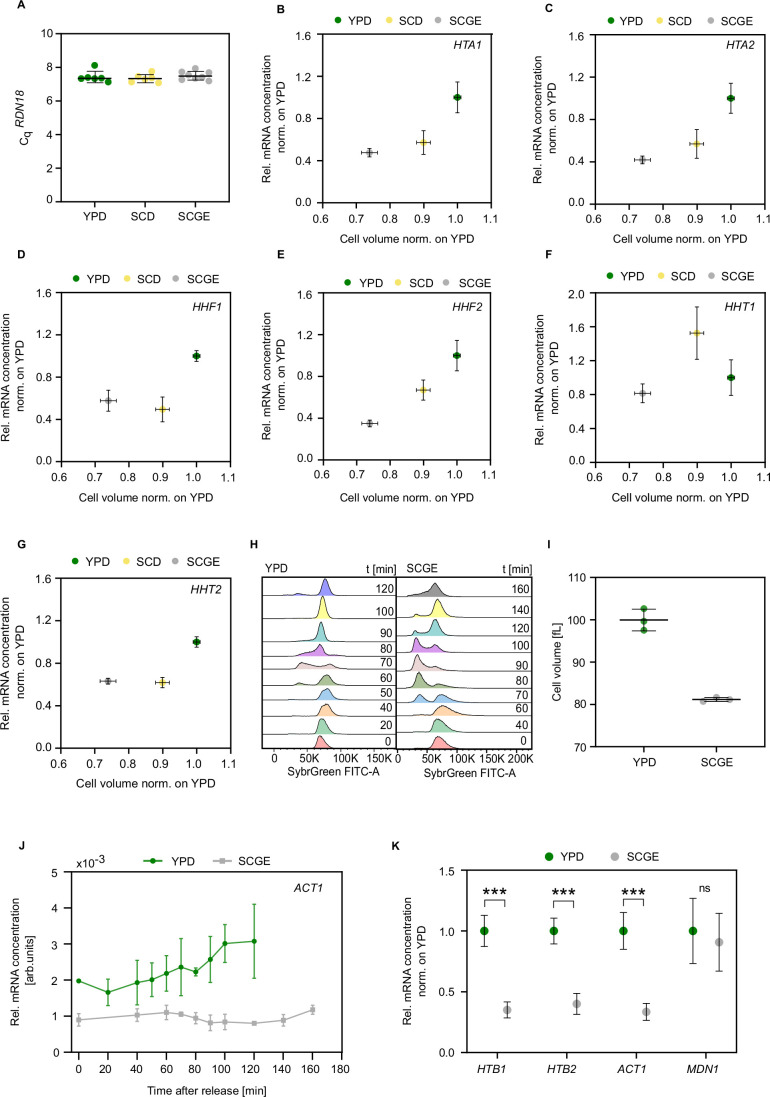
Figure EV2. Histone mRNA concentrations decrease with decreasing nutrient-specific cell volume.
(A) Cq values of the reference ribosomal RNA RDN18 were obtained by RT-qPCR analysis across different nutrient conditions. Lines and error bars represent the means and standard deviations of n = 6–8 independent measurements shown as individual dots. (B–G) Relative mRNA concentrations of HTA1 (B), HTA2 (C), HHF1 (D), HHF2 (E), HHT1 (F), and HHT2 (G) as a function of the relative nutrient-specific cell volume. Mean and standard deviation of at least four biological replicates are shown. (H) Exemplary nutrient-dependent cell cycle distributions were measured by flow cytometry at defined time points throughout the cell cycle of synchronized cells with β-estradiol-inducible CDC20. (I) Mean cell volumes of cells with β-estradiol-inducible CDC20, measured in YPD and SCGE at t = 70 min and t = 100 min, respectively. Lines and error bars represent the means and standard deviations of n = 3 independent measurements shown as individual dots. (J) mRNA concentrations of ACT1 (normalized to RDN18) were determined using RT-qPCR after synchronous release into the cell cycle (t = 0) triggered by the addition of 200 nM β-estradiol. Mean and standard deviation of four biological replicates are shown. (K) RT-qPCR analysis of the relative mRNA concentrations of HTB1, HTB2, ACT1, and MDN1 in asynchronous cells with β-estradiol-inducible CDC20. Mean fold changes with respect to YPD and standard deviations of n = 3–6 replicate measurements are shown; ***PHTB1 = 1.35 × 10⁻⁵; ***PHTB2 = 2.18 × 10⁻⁵; ***PACT1 = 3.08 × 10⁻⁵.

