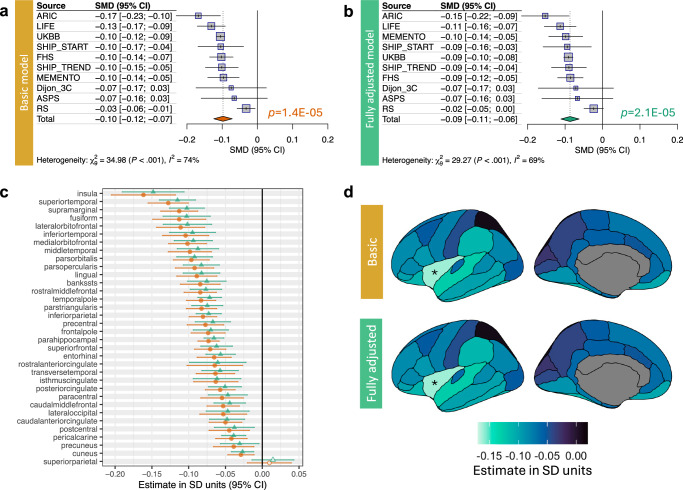
Fig. 1. Association between white matter hyperintensities and cortical thickness.
Forrest plot and meta-analytic summary statistic for the effect of WMH volume on mean cortical thickness within a baseline- (a) and fully-covariate adjusted model, including vascular risk factors (b). Meta-analytic effect sizes of WMH-cortical thickness association per cortical region are shown as a forest plot (c) and plotted on the surface of the cerebral cortex using ggseg76 (d). For (a–c), two-sided t tests were used to evaluate the null hypothesis of no WMH-cortical thickness association; results with FDR-corrected p-values (adjusted for regions and models) less than 0.05 are marked by solid diamonds; and error bars represent 95% confidence intervals. The exact p-values are available in the Source Data.

