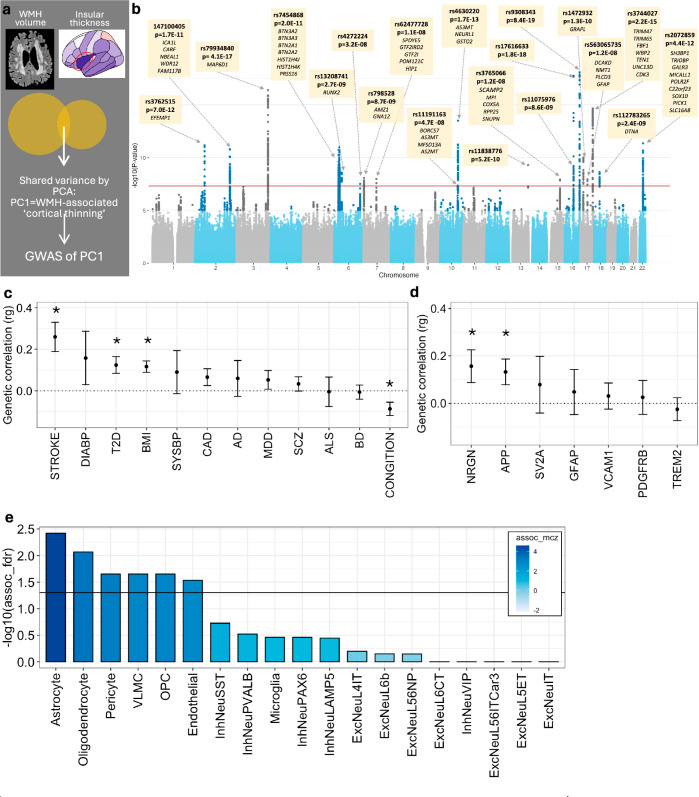
Fig. 2. Genetic underpinnings of the WMH-cortical thickness association.
a Schematic representation of the shared variance between WMH volume and insular cortical thickness captured via principal component 1 (PC1). b Summary statistics of the meta-GWAS of PC1. A two-sided Wald test was used to evaluate the null hypothesis of no SNP-PC1 association. The genome-wide significance level of 5e-08 is indicated by the red horizontal line. Each independent genome-wide significant variant is annotated, and its cis-eQTL-regulated genes are listed below variant rsID. The exact p-values are available in Supplementary Data 2. c LD-score regression estimates between the GWAS of PC1 and vascular risk factors, and neurodegenerative/psychiatric traits (error bars represent standard error, * p < 0.05, two-sided test). d LD-score regression between GWAS of PC1 and plasma protein levels of select neurodegeneration-related markers (error bars represent standard error, * nominal p < 0.05, two-sided test). e Cell-type-specific enrichment of polygenic signals from the GWAS of PC1, using single-cell disease relevance score testing35. Filled in colour represents Monte Carlo-based Z statistics. DIAB Diastolic Blood Pressure, T2D Type 2 Diabetes, BMI Body Mass Index, SYSBP Systolic Blood Pressure, CAD Coronary Artery Disease, AD Alzheimer’s Disease, MDD Major Depressive Disorder, SCZ Schizophrenia, BD Bipolar Disorder, NRGN neurogranin, APP amyloid precursor protein, SV2A Synaptic vesicle protein 2, GFAP Glial fibrillary acidic protein, VCAM1 Vascular cell adhesion protein 1, PDGFRB platelet-derived growth factor receptor beta, TREM2 Triggering receptor expressed on myeloid cells 2. These genes were a priori selected as related to biomarkers of neurodegeneration77. For (c–e), the exact p-values are available in the Source Data.

