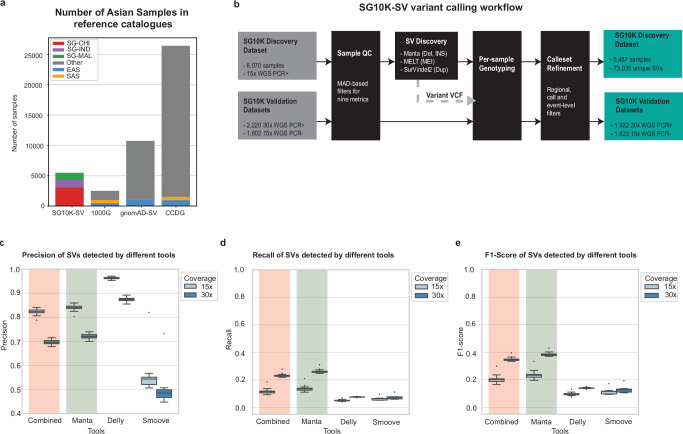
Fig. 1. SG10K-SV-r1.4 Structural Variant landscape.
a Number of Asian samples in SG10K-SV-r1.4 compared to (short-read derived) 1000 genomes SV, gnomAD-SV and CCDG reference studies. b SG10K-SV-r1.4 analysis pipeline diagram. c–e Benchmarking of various SV tools for SV detection using 34 1000 G samples with 2 different depths (30x coverage and downsampled 15x coverage). c Boxplot showing the precision between 15x and 30x coverage for each SV caller. Combined refers to variants that are detected in all three pipelines. The boxplots display the median and first/third quartiles. d Boxplot showing the recall between 15x and 30x coverage for each SV caller. The boxplots display the median and first/third quartiles. e Boxplot showing the F1-score between 15x and 30x coverage for each SV caller. The boxplots display the median and first/third quartiles.

