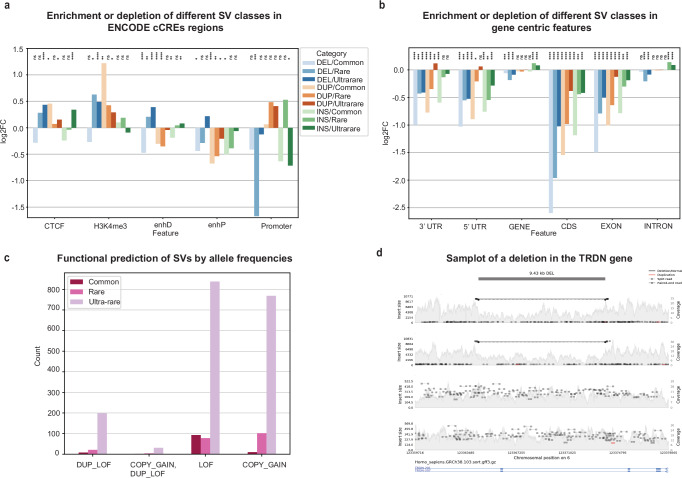
Fig. 3. Functional impact of structural variations in the SG10K-SV-r1.4.
a: Distribution of SVs (Deletions, Insertions, Duplications) disrupting regulatory regions (ENCODE cCREs) across allele frequency bins. Common indicates variants with allele frequency ≥0.01; rare indicates variants with allele frequency ≥0.001 and allele frequency <0.01; ultra-rare variants refers to variants with allele frequency <0.001. P-value was computed using 10,000 random permutations and correction with Benjamini–Hochberg false discovery rate was done. Ns indicates not significant p-value, * indicates p-value < 0.05, **p-value < 0.01, *** indicates p-value < 0.001, **** indicates p-value < 0.0001. The exact p-value for the analysis can be found in Supplementary Data 6. b Distribution of SVs (Deletions, Insertions, Duplications) disrupting (GENCODE) gene centric features across allele frequency bins. p-value was computed using 10,000 random permutations and correction with Benjamini Hochberg false discovery rate was done. Ns indicates not significant p-value, * indicates p-value < 0.05, **p-value < 0.01, *** indicates p-value < 0.001, **** indicates p-value < 0.0001. The exact p-value for the analysis can be found in Supplementary Data 7. c In silico prediction of functional consequences of SVs segregated by allele frequencies. d Samplot of a 9.43 kb deletion event overlapping the TRDN gene region.

