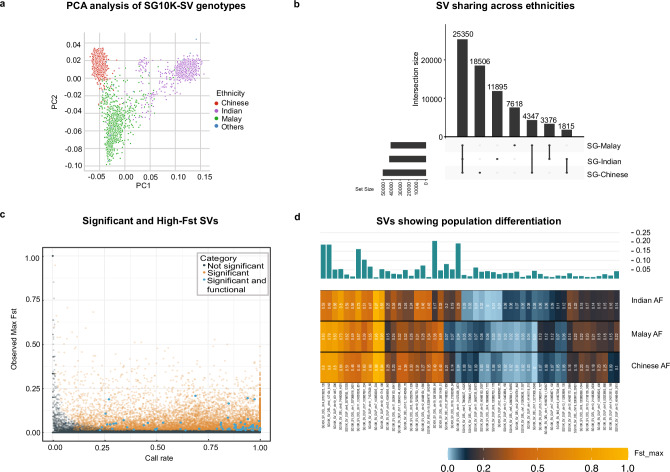
Fig. 4. Population specificity of SVs.
a Population structure revealed by PCA analysis of SG10K-SV-r1.4 genotype values. Each point corresponds to an individual, coloured according to its ethnicity, x and y axis represents the first two principal component respectively. b Proportion of SVs found in all, two or one populations. c Scatter plot of SV’s fixation index (Fst) as a function of their call rate. d Allele frequencies in Chinese, Indian and Malay for selected SVs with elevated fixation index (Fst).

