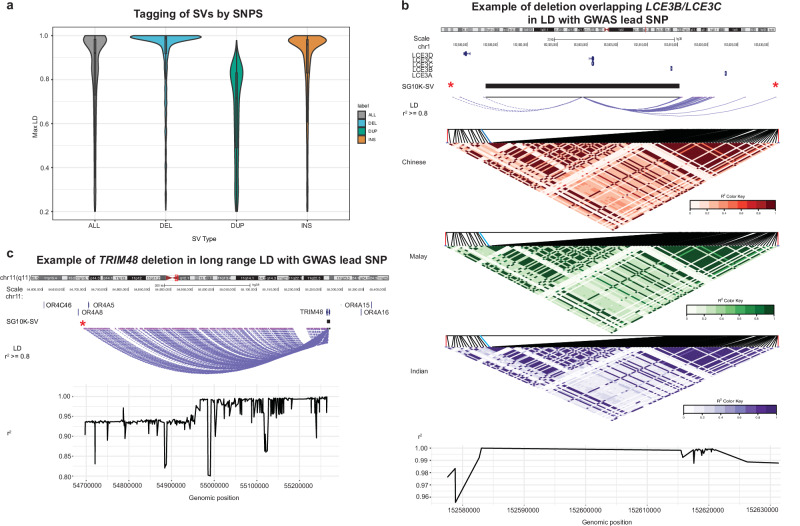
Fig. 5. Linkage disequilibrium between SVs and SNPs.
a Tagging of SVs by SNPs: Violin plots and boxplots showing the distribution of the maximum R2 value to SNPs for each SV. The boxplots and violin plots were plotted for 1400 deletions, 1394 duplications and 2903 insertions, which are in LD with SNPs/small indels in the SG10K_Health dataset. The boxplots display the median and first/third quartiles. b Candidate causal SV: Example of a deletion affecting LCE3B/LCE3C gene, in high LD with two Psoriasis GWAS SNPs. The SNPs are significantly associated with Psoriasis. LD structure plots are shown for the three ethnicities. The star indicates the GWAS lead SNP and the black bar indicates the SV. The line plot shows the r2 of variants in the region with respect to the SV. c Candidate causal SV: Example of a deletion in TRIM48 gene, in high LD with an intergenic GWAS-lead SNP associated with altered glomerular filtration rate. The lines indicate LD between GWAS-lead SNP and deletion with r2 >= 0.8. The star indicates the GWAS lead SNP and the black bar indicates the SV. The line plot shows the r2 of variants in the region with respect to the SV. Genomic region overviews in panels b and c include84 screenshots from http://genome.ucsc.edu.

