. 2024 Nov 3;12(11):e009902. doi: 10.1136/jitc-2024-009902

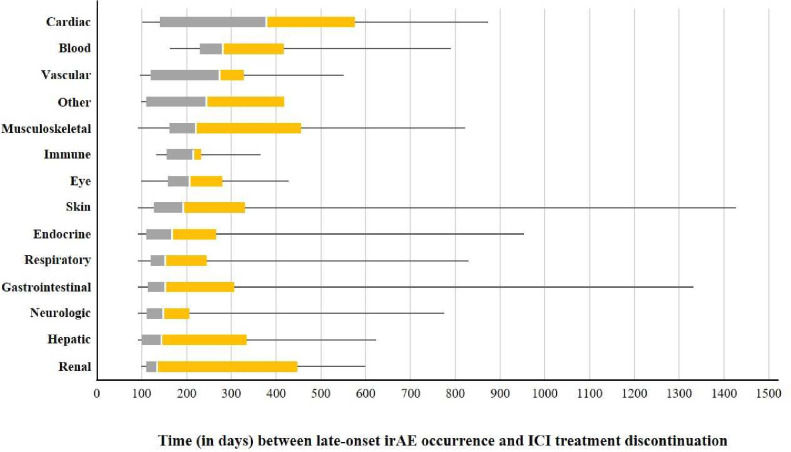
Figure 2. Boxplot displaying the time (in days) between late-onset immune-related adverse event occurrence and immune checkpoint inhibitor treatment discontinuation according to organ toxicity. Within each box, vertical white lines denote median values; boxes extend from the 25th to the 75th percentiles of each group’s distribution of values; horizontal extending lines denote the minimum and maximum values observed. “Other” included the following seven events reported in five individual case safety reports and not belonging to any of the predefined organ toxicities: immune-mediated adverse reaction (n=2), serositis, autoinflammatory disease, smooth muscle antibody positive, anti-neutrophil cytoplasmic antibody positive, anti-actin antibody positive (all n=1). ICI, immune checkpoint inhibitor; irAEs, immune-related adverse events.

Figure 2