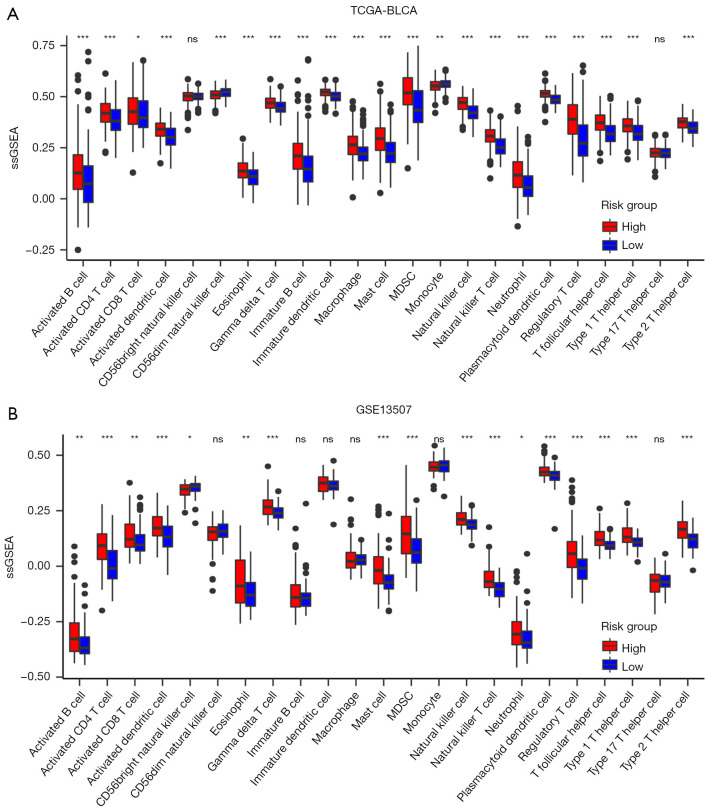
Figure 6.
Immune characteristics between the high- and low-risk groups. (A) The ssGSEA was conducted on TCGA-BLCA data to assess the profiles of immune cells within high- and low-risk groups. Statistical disparities among the clusters were evaluated using the Kruskal-Wallis H test. (B) The ssGSEA was also performed using GSE13507 data to examine immune cell profiles within high- and low-risk groups. The Kruskal-Wallis H test was utilized to compare statistical differences among the clusters, with significance indicated as *, P<0.05, **, P<0.01, and ***, P<0.001. ssGSEA, single-sample gene set enrichment analysis; TCGA, The Cancer Genome Atlas; BLCA, bladder cancer; MDSC, myeloid-derived suppressor cell; ns, not significant.

