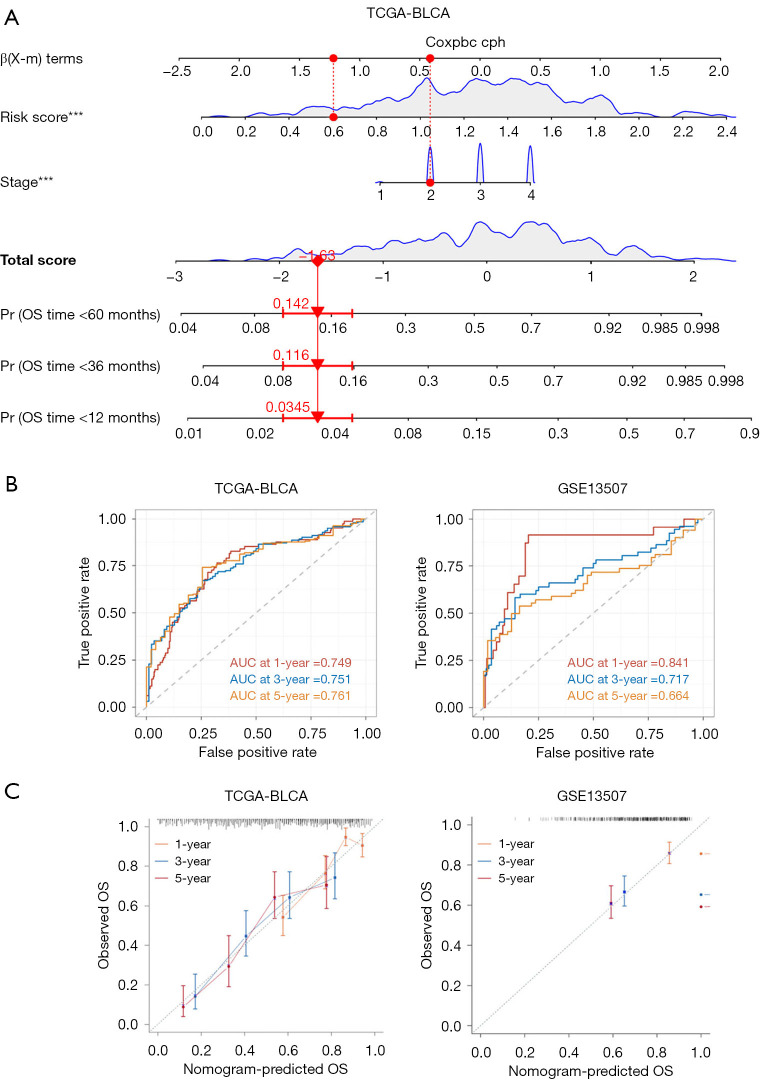
Figure 7.
Construction of a nomogram. (A) A nomogram was developed to predict the 1-, 3-, and 5-year OS of BLCA patients in the training set. (B) ROC curves were constructed to predict the 1-, 3-, and 5-year survival rates in both the training (TCGA) and testing (GSE13507) cohorts. (C) Calibration curves were generated to evaluate the performance of the nomogram in predicting the 1-, 3-, and 5-year survival rates in both the training and testing cohorts. ***, P<0.001. TCGA, The Cancer Genome Atlas; BLCA, bladder cancer; AUC, area under the curve; OS, overall survival; ROC, receiver operating characteristic.

