Figure 5.
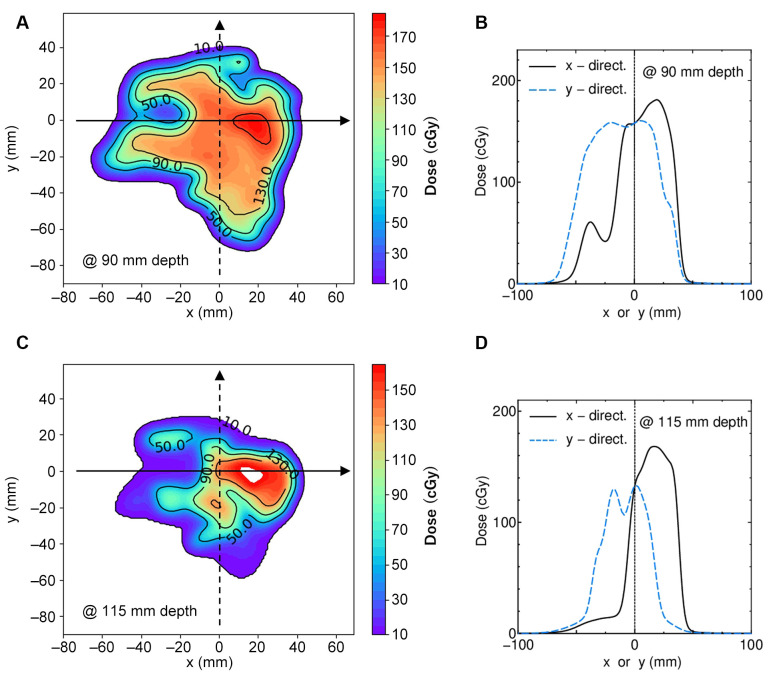
(A) Two-dimensional dose distribution of the plane perpendicular to the beam axis at 90 mm depth in the H&N2 case. (B) Dose curves in x- and y-directions on the arrows in (A) are represented by the solid and dashed curves. (C)(D) correspond to (A)(B) but for a 115 mm depth. Measurements recorded at x=y=0.

