Fig. 2.
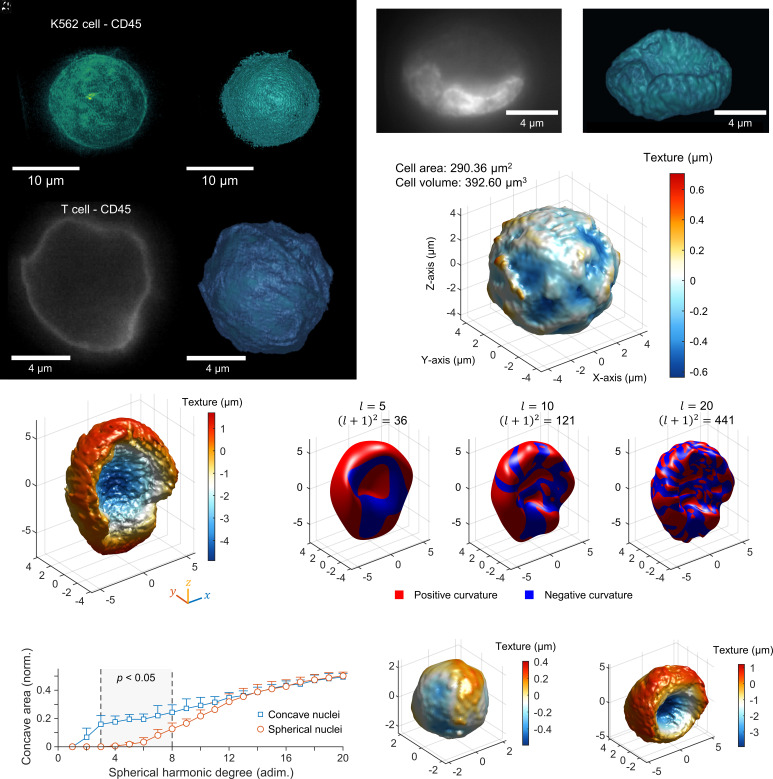
ADOPT enables suspended single-cell 3D isotropic imaging and organelle morphometry. (A) Isotropically resolved suspension cells (K562 cell line) stained with anti-CD45 – Alexa Fluor 488, visualized via its MIP. (B) Isosurface model of 3D fluorescence data in (A). (C) Two-dimensional slice of an activated T cell (CD25+), marked with anti-CD45-Alexa Fluor 488 taken during acquisition of the required 360° projections for 3D reconstruction via OPT. (D) Isosurface of the CD45 fluorescence level in (C). (E) Two-dimensional image of the stained nucleus (Hoechst 33342 dye) of a K562 cell. (F) Three-dimensional reconstruction of the nuclear content distribution of the nucleus in (E). (G) Isosurface of the CD45 marker 3D distribution in a K562 cell, detailing quantitative data of its texture with a heatmap. Texture map was defined as the distance between a surface patch and the average radius of the complete isosurface. (H) Texture map of the K562 cell nucleus in (E and F), displaying an enlarged nuclear groove structure. (I) Shape approximation of surface model in (H) via SPHARMs expansion of increasing degree, . The total number of harmonic coefficients is given by , which accounts for azimuthal components in the expansion. The sign of the Gaussian curvature of each -degree surface model was computed and displayed on the surface to evince regions of negative and positive curvature. Predominantly concave sections of the shapes were defined to be the portions with negative curvature. (J) Plot of the fraction of the nucleus surface area that is concave (negative Gaussian curvature) for a given SPHARM degree expansion, which evinces quantifiable morphological differences between spherical and concave-shaped nuclei. Texture maps of (K) spherical and (L) concave K562 nuclei.

