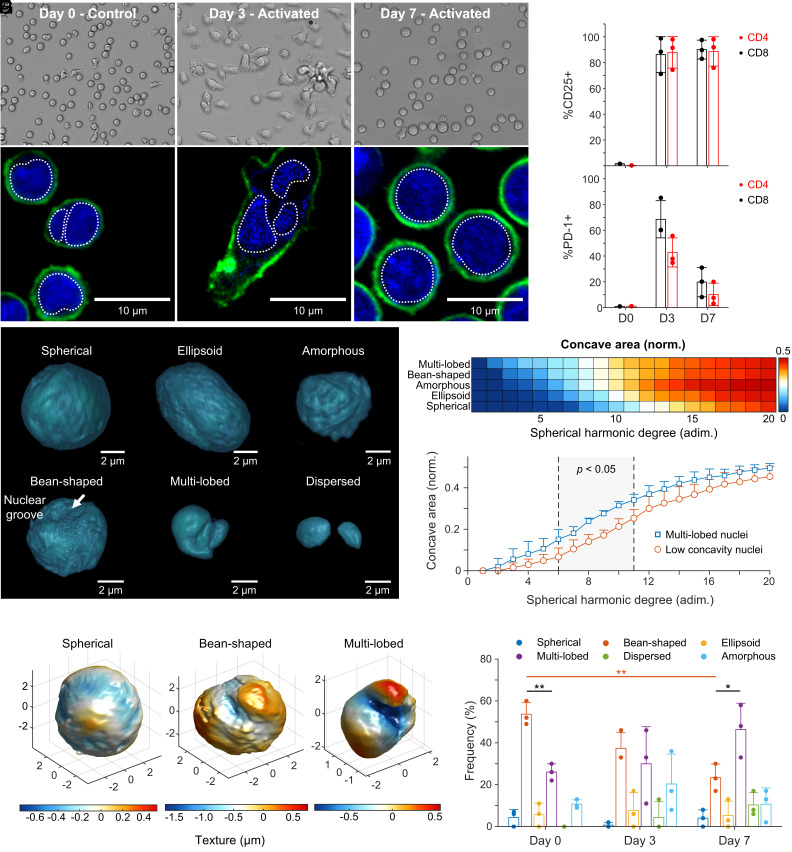
Fig. 5.
Primary T cell activation phenotype and nuclear morphometry via ADOPT. (A) Brightfield images of T cells as a function of the number of days after Dynabead-mediated activation. (B) Corresponding CLSM 2D optical sections, with cells stained for CD45 surface marker and nuclear content. (C and D) Percent of cells expressing CD25 and PD-1 markers for the N = 3 donors, plotted by days postactivation and classified by helper (CD4+) or cytotoxic (CD8+) phenotype. (E) Activated T cell nuclear content morphologies identified via ADOPT 3D reconstructions. (F) Colormap of the concave surface area fraction for simply connected T cell nuclear morphologies (excluding dispersed), plotted by increasing degree of SPHARM representation (i.e., increasing surface detail). (G) Surface concavity differences between the identified multilobed nuclei (N = 3), and low concavity morphologies (amorphous, ellipsoid, and spherical). (H) Three representative T cell nucleus morphologies of topological genus zero, illustrating their textural differences via a colormap. (I) Distribution of T cell nuclear morphology phenotypes, shown as a function of days after activation (N = 3 donors, two-tailed t test). Error bars throughout the figure represent mean values ± SD. In (I), *P < 0.05 and **P < 0.005.

