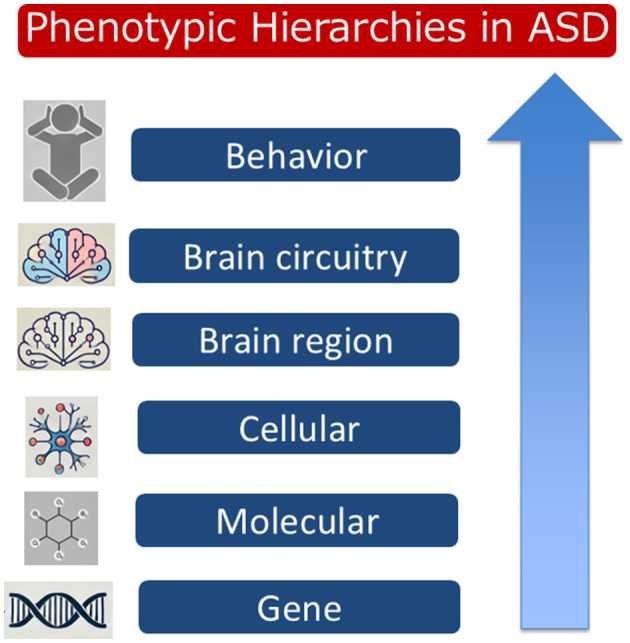
Figure 1.

A hierarchical representation of phenotypic impacts in Autism Spectrum Disorder (ASD). The diagram illustrates the relationship between different levels, from molecular and cellular alterations to gene expressions, brain regions, brain circuitry, and resulting behavioral phenotypes. This hierarchy emphasizes the multi-level approach needed to understand the diverse manifestations of ASD.
