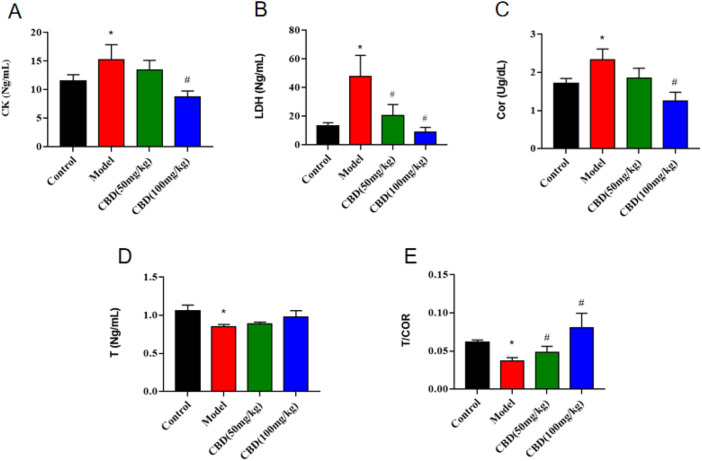
FIGURE 2.
Effect of CBD on CK, T, Cor and LDH parameters in experimental rats. (A) CK (n = 6, one-way ANOVA). (B) LDH (n = 6, one-way ANOVA). (C) Cor (n = 6, one-way ANOVA). (D) T (n = 6, one-way ANOVA). (E) T/COR (n = 6, one-way ANOVA). All date are expressed as mean ± S.D. *p < 0.05 compared with the control group. # p < 0.05 compared with the model group.

