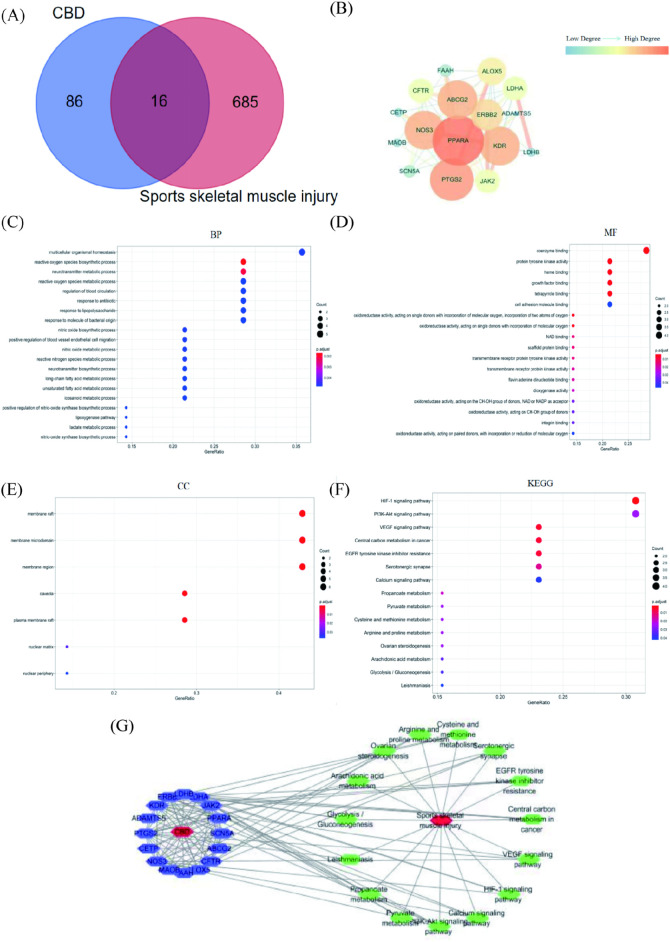
FIGURE 6.
Results of network pharmacological analysis. (A)Venn Diagram of CBD targets and exercise-induced skeletal muscle injury targets. (B) PPI network of intersection targets of CBD in the treatment of exercise-induced skeletal muscle injury. (C–E) GO analysis bubble map of CBD. (F) KEGG analysis bubble map of CBD. (G) Network diagram of “component-target-pathway-disease.”

