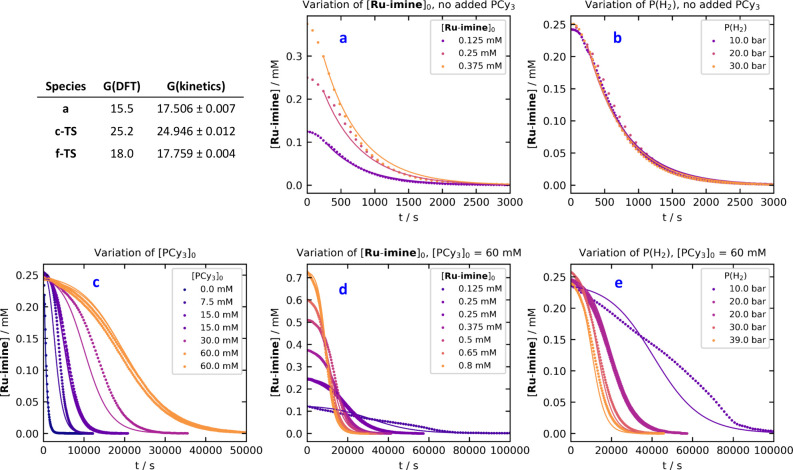
Figure 11.
Comparison of the experimental kinetic data (points) and the time courses calculated with the optimized microkinetic model, after adjusting the free energies of a, c-TS, and f-TS to obtain the best fit. (a) Experiments where [Ru-imine]0 was varied with no added PCy3. (b) Experiments where the hydrogen pressure was varied with no added PCy3. (c) Experiments where [PCy3]0 was varied. (d) Experiments where [Ru-imine]0 was varied with 60 mM added PCy3. (e) Experiments where the hydrogen pressure was varied with 60 mM added PCy3.

