
Figure 4.
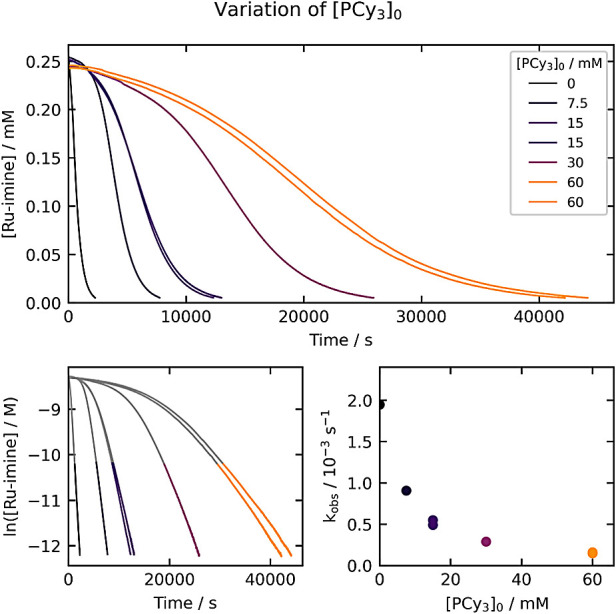
Kinetics of Ru-imine hydrogenation with varying [PCy3]0. The top plot shows the evolution of [Ru-imine] over time, and the bottom-left plot shows the evolution of ln[Ru-imine] over time. The bottom-right plot shows the dependence of kobs on [PCy3]0. The kobs values (top right) are derived from the period between 85% and 98% conversion, as highlighted in the bottom-left plots.