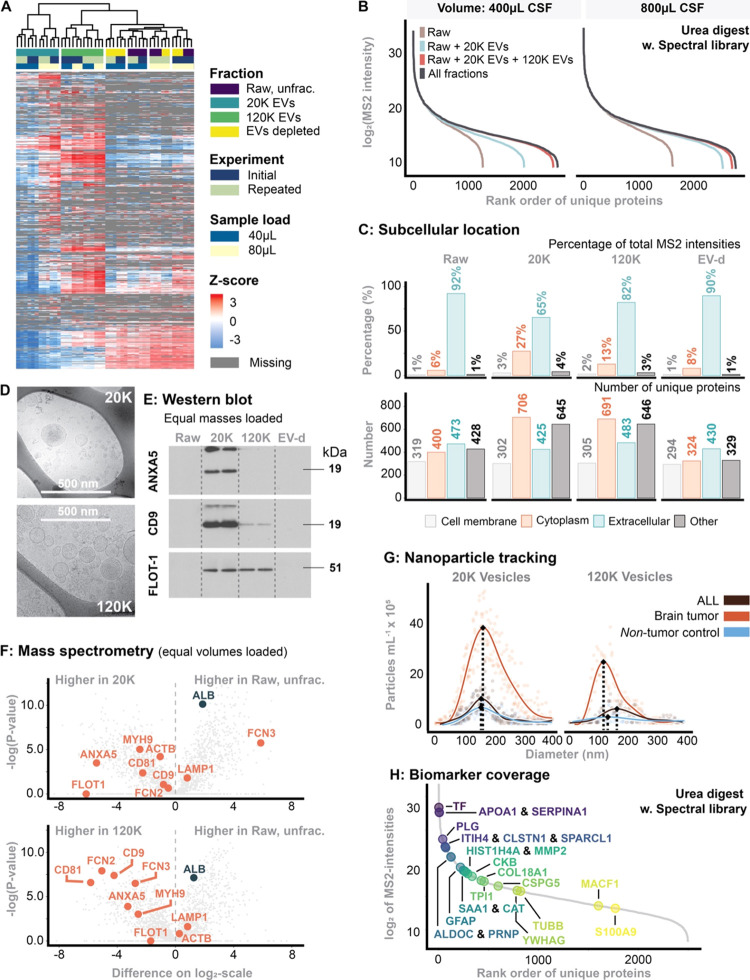
Figure 2.
(A) Heatmap of unsupervised clusters comprising all fractions. The experiment was repeated two times (“Initial” is the first experiment, while “Repeated” was the same experiment 3 months later). (B) Dynamic range and proteome depth stratified for sample input volume and each fraction. The intensity corresponds to median of MS2-intensity across the workflow triplicates. (C) Predicted subcellular location using the DeepLoc algorithm.30 (D) Cryo-transmission electron microscopy of 20K and 120K EVs. (E) Western blotting probed for common EV markers. In this experiment, equal sample masses were loaded. (F) Comparison of MS2-intensities between fractions with emphasis on EV markers. In this experiment, equal volumes were loaded. (G) Nanoparticle tracking analysis of 20K and 120K EVs stratified for patients with ALL or a brain tumor as well as nontumor controls. (H) Biomarker coverage of previous reported potential biomarkers, summarized in ref (10).

