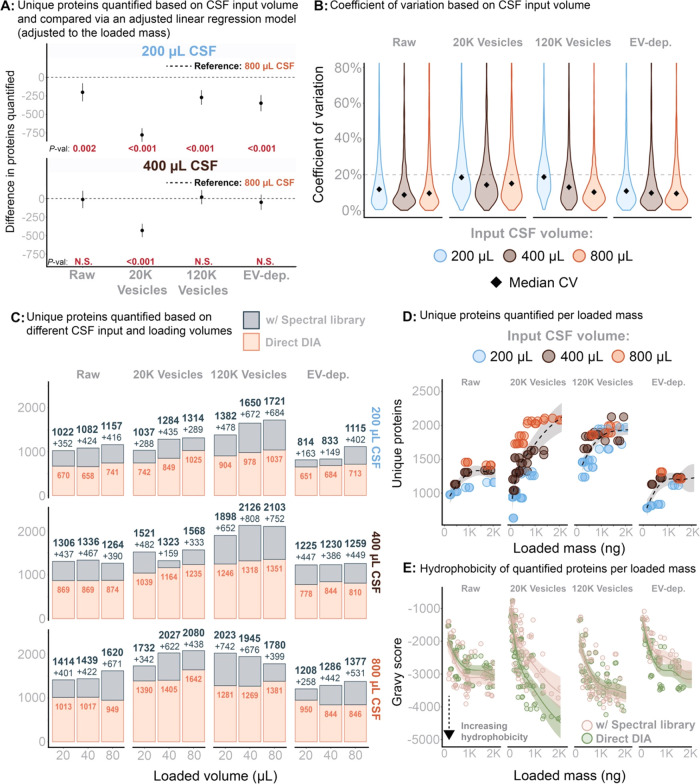
Figure 3.
(A) The total number of unique proteins was analyzed using a linear regression model, with adjustments for the mass loaded onto the EvoTip and the CSF input volume. This model evaluated the impact of these variables on the number of unique proteins while accounting for their interrelationships. P-values for statistical significance are provided below each estimate to indicate the significance of the CSF input variable. (B) Reproducibility based in workflow triplicates and measured by the coefficient of variation across different sample input volumes. (C) Total number of proteins quantified with and without application of the gas-phase spectral library. Stratified for input sample volume and volume-based load. (D) Total number of proteins quantified within each fraction as a function of peptide mass loaded (measured on A280). (E) Total sample hydrophobicity (all peptides summed) measured as Gravy score and as a function of peptide mass loaded (A280 based).

