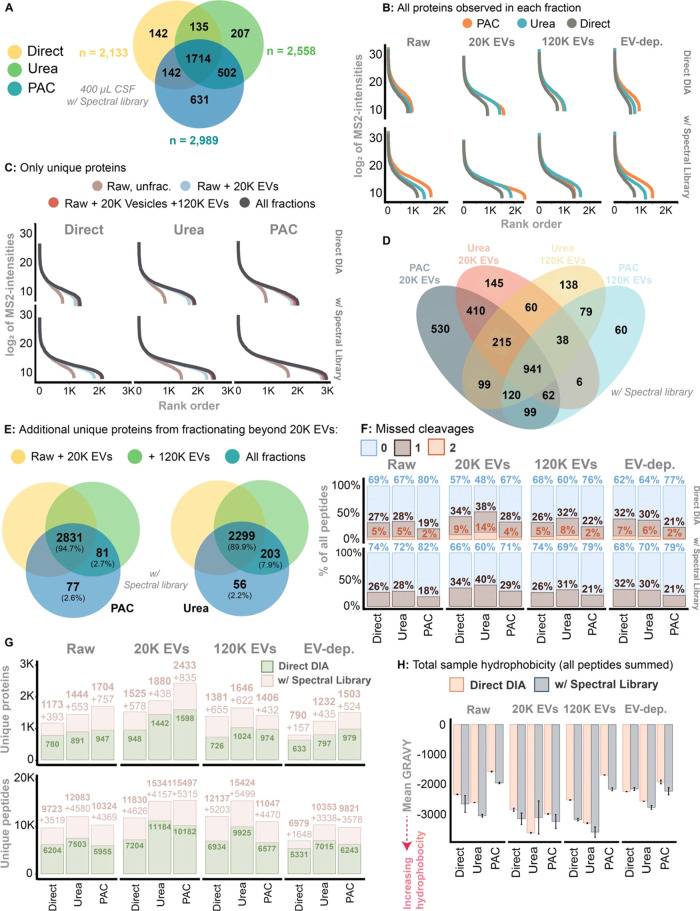
Figure 4.
(A) Venn diagram of total numbers of proteins identified across all fractions and by each digest method. The identified proteins were quantified from an input sample volume of 400 μL and search via the gas-phase spectral library. (B) The dynamic range and proteome depth in each digest and protein extraction method in within the individual fractions, stratified for usage of the gas-phase spectral library. All proteins identified were included. (C) The same as B, but now including the addition of unique proteins identified within each fraction. I.e., the unique proteins were allocated to the fraction in which it was first observed. (D) A Venn diagram illustrating the overlap between 20K and 120K EVs identified using the PAC-based vs urea-based digest (using the gas-phase spectral library). (E) Unique proteins identified in the 120K and EV-depleted fraction on top of what have been identified in the Raw +20K EV fraction. Here, only the PAC-based and urea-based approach and search using the gas-phase spectral library. (F) Missed cleavages in each fraction while stratified for digest and protein extraction method as well as usage of the gas-phase spectral library. (G) Similarly stratified, here showing unique proteins and unique peptides identified in each fraction. (H) Total sample hydrophobicity based on all peptides summed. The hydrophobicity was measured as the Gravy score. Stratified for each method used for protein extraction and fraction.

