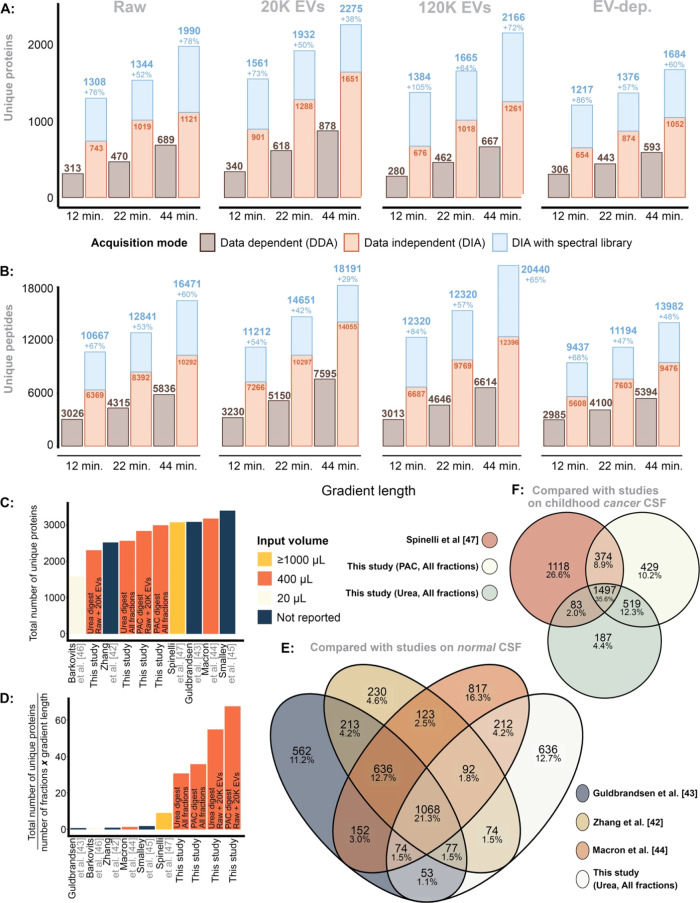
Figure 5.
(A) Unique proteins identified
in each fraction, here stratified
for gradient length (100, 60, 40 SPD) while comparing DDA vs DIA,
with and without the gas-phase spectral library using the sample pool.
(B) The same, but for unique peptides. (C) Number of unique proteins
identified in this study vs previous literature. (D) The efficiency
of quantifying the number of unique proteins, here measured as  . (E) The overlap
between unique proteins
identified in this study and compared to previous studies on CSF from
healthy donors. (G) The same, but the CSF study was performed on EV-enriched
samples from pediatric patients with a brain tumor.

