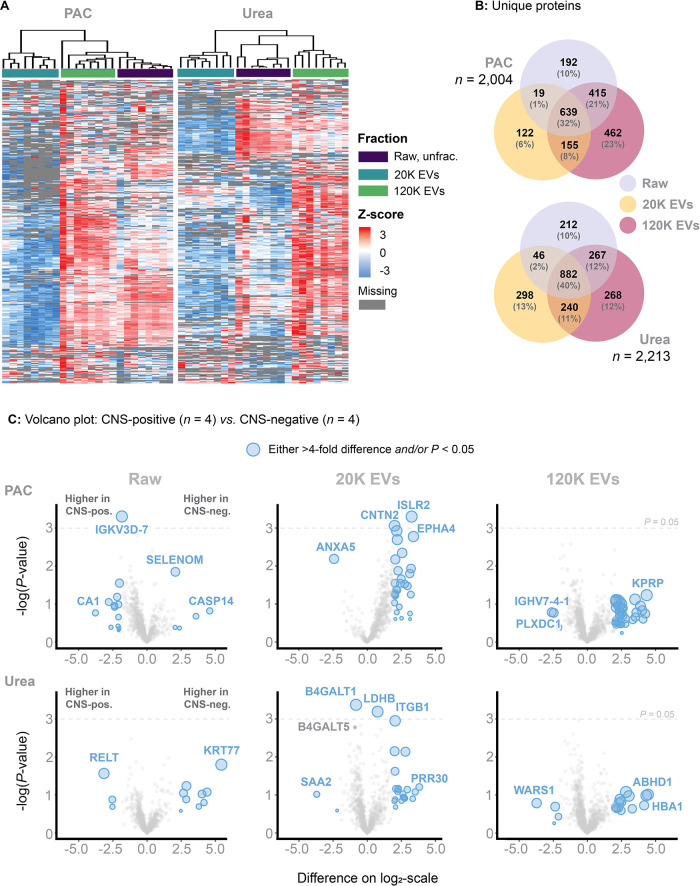
Figure 6.
Methodology applied to individual samples (in contrast to pooled samples). (A) A heatmap based on unsupervised clusters. Here showing that PAC-based on-bead digest performs instable compared to the urea-based in-solution digest. (B) Number of unique proteins identified across each fraction and within the PAC-based on-bead and urea-based in-solution digest. (C) Volcano plots comparing the log 2-transformed MS2-intensities obtained from analyzing four FCM-positive and four FCM-negative patients, here including Raw, 20K EVs and 120K EVs for both PAC-based on-bead and urea-based in-solution digest.

