
Figure 1.
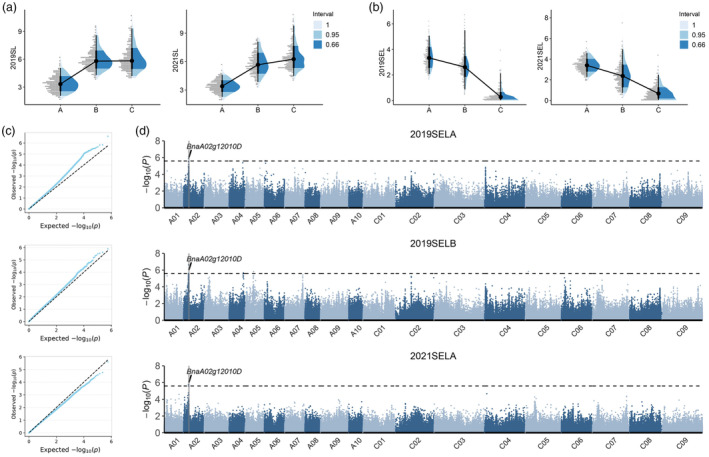
SNP identification of the newly dynamic characters of silique elongation with GWAS analysis. (a, b) Dynamic statistical analysis with the SL and corresponding silique elongation length among 588 materials over two different years, Letter of A, B and C represent the three stages with 0–10, 10–20 and 20–30 days after flowering, respectively; (c, d) Quantile‐quantile plots and manhattan plots resulting from the GWAS results for silique elongation length, the black dashed line represents the Bonferroni‐adjusted significance threshold.