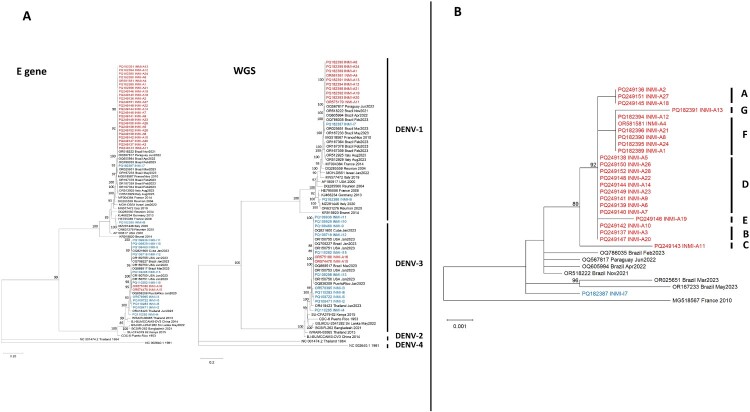
Figure 2.
Panel A: Phylogenetic analysis based on the complete E gene and WGS of autochthonous and imported cases of DENV-1 and DENV-3. Sequences from autochthonous cases are highlighted in red, and those from imported cases are highlighted in blue. Bootstrap values > 80 are reported aside the corresponding nodes. Panel B: Enlarged detail of the phylogenetic tree of complete E gene sequences from autochthonous DENV-1 cases (red). The identified subclusters are indicated by capital letters. Bootstrap values > 80 are reported aside the corresponding nodes.

