Fig. 3.
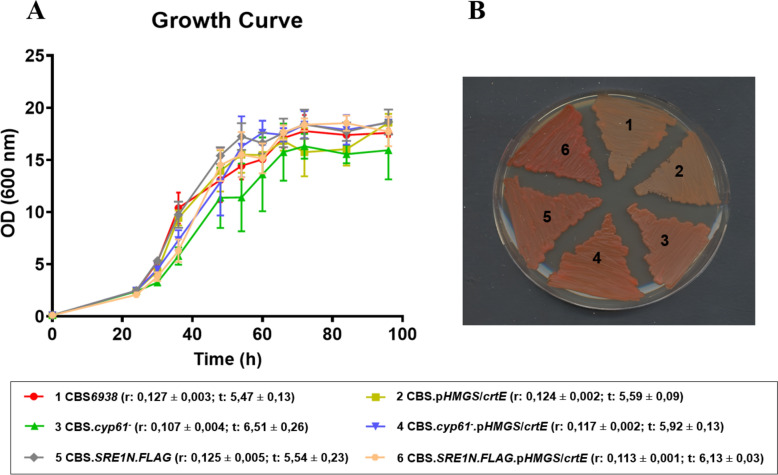
Growth curves and color phenotype of strains. A Growth curves of strains CBS6938, CBS.cyp61−, CBS.SRE1N.FLAG and their respective mutants: CBS.pHMGS/crtE, CBS.cyp61−.pHMGS/crtE and CBS.SRE1N.FLAG. pHMGS/crtE. The strains were cultured in liquid YM medium at 22 °C with constant agitation, and growth was monitored at 600 nm. Growth rate (r) and generation time (t) were determined based on the method described by Zwietering et al. in 1990 [50], and values represent the average ± standard deviation of three simultaneous cultures for each strain. It should be noted that growth parameters were estimated only as an approximation to assess significant alterations in growth. No statistically significant differences in growth parameters were observed between mutant and their respective parental strain (p-value < 0.01). B Strains cultured on YM agar plates (1.5%) at 22 °C for 72 h numbered as follows: CBS6938 (1), CBS.pHMGS/crtE (2), CBS.cyp61− (3), CBS.cyp61−.SRE1.pHMGS/crtE (4), CBS.SRE1N.FLAG (5), and CBS.SRE1N.FLAG.pHMGS/crtE (6)

