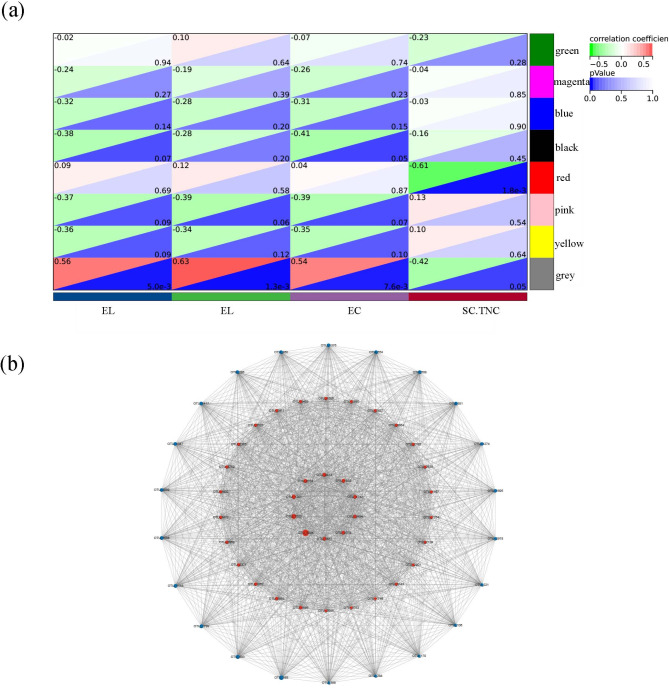
Fig. 4.
Identification of key module and hub OTUs based on WGCNA. (a) Correlation between module eigenvalues and traits of golden snub-nosed monkey. Depth of colour corresponds to depth of correlation and P value of each module. (b) Network graph of the hub OTUs. Each node represented the OTUs who’s between centrality value was in the top 50%, and its colour represented the corresponding module, the size of each node represented the betweenness centrality value, the size of each line thickness represented the weight value between nodes (OTUs). Visualization of the complete weighted networks comprising 58 candidate hub OTUs associated with SC.TNC. Among them, 36 red nodes represent unique bacterial species in the LGT population, while 22 blue nodes denote species shared between the LGT and FP populations

