
Extended Data Fig. 3. Local resolution and representative fit between map and model.
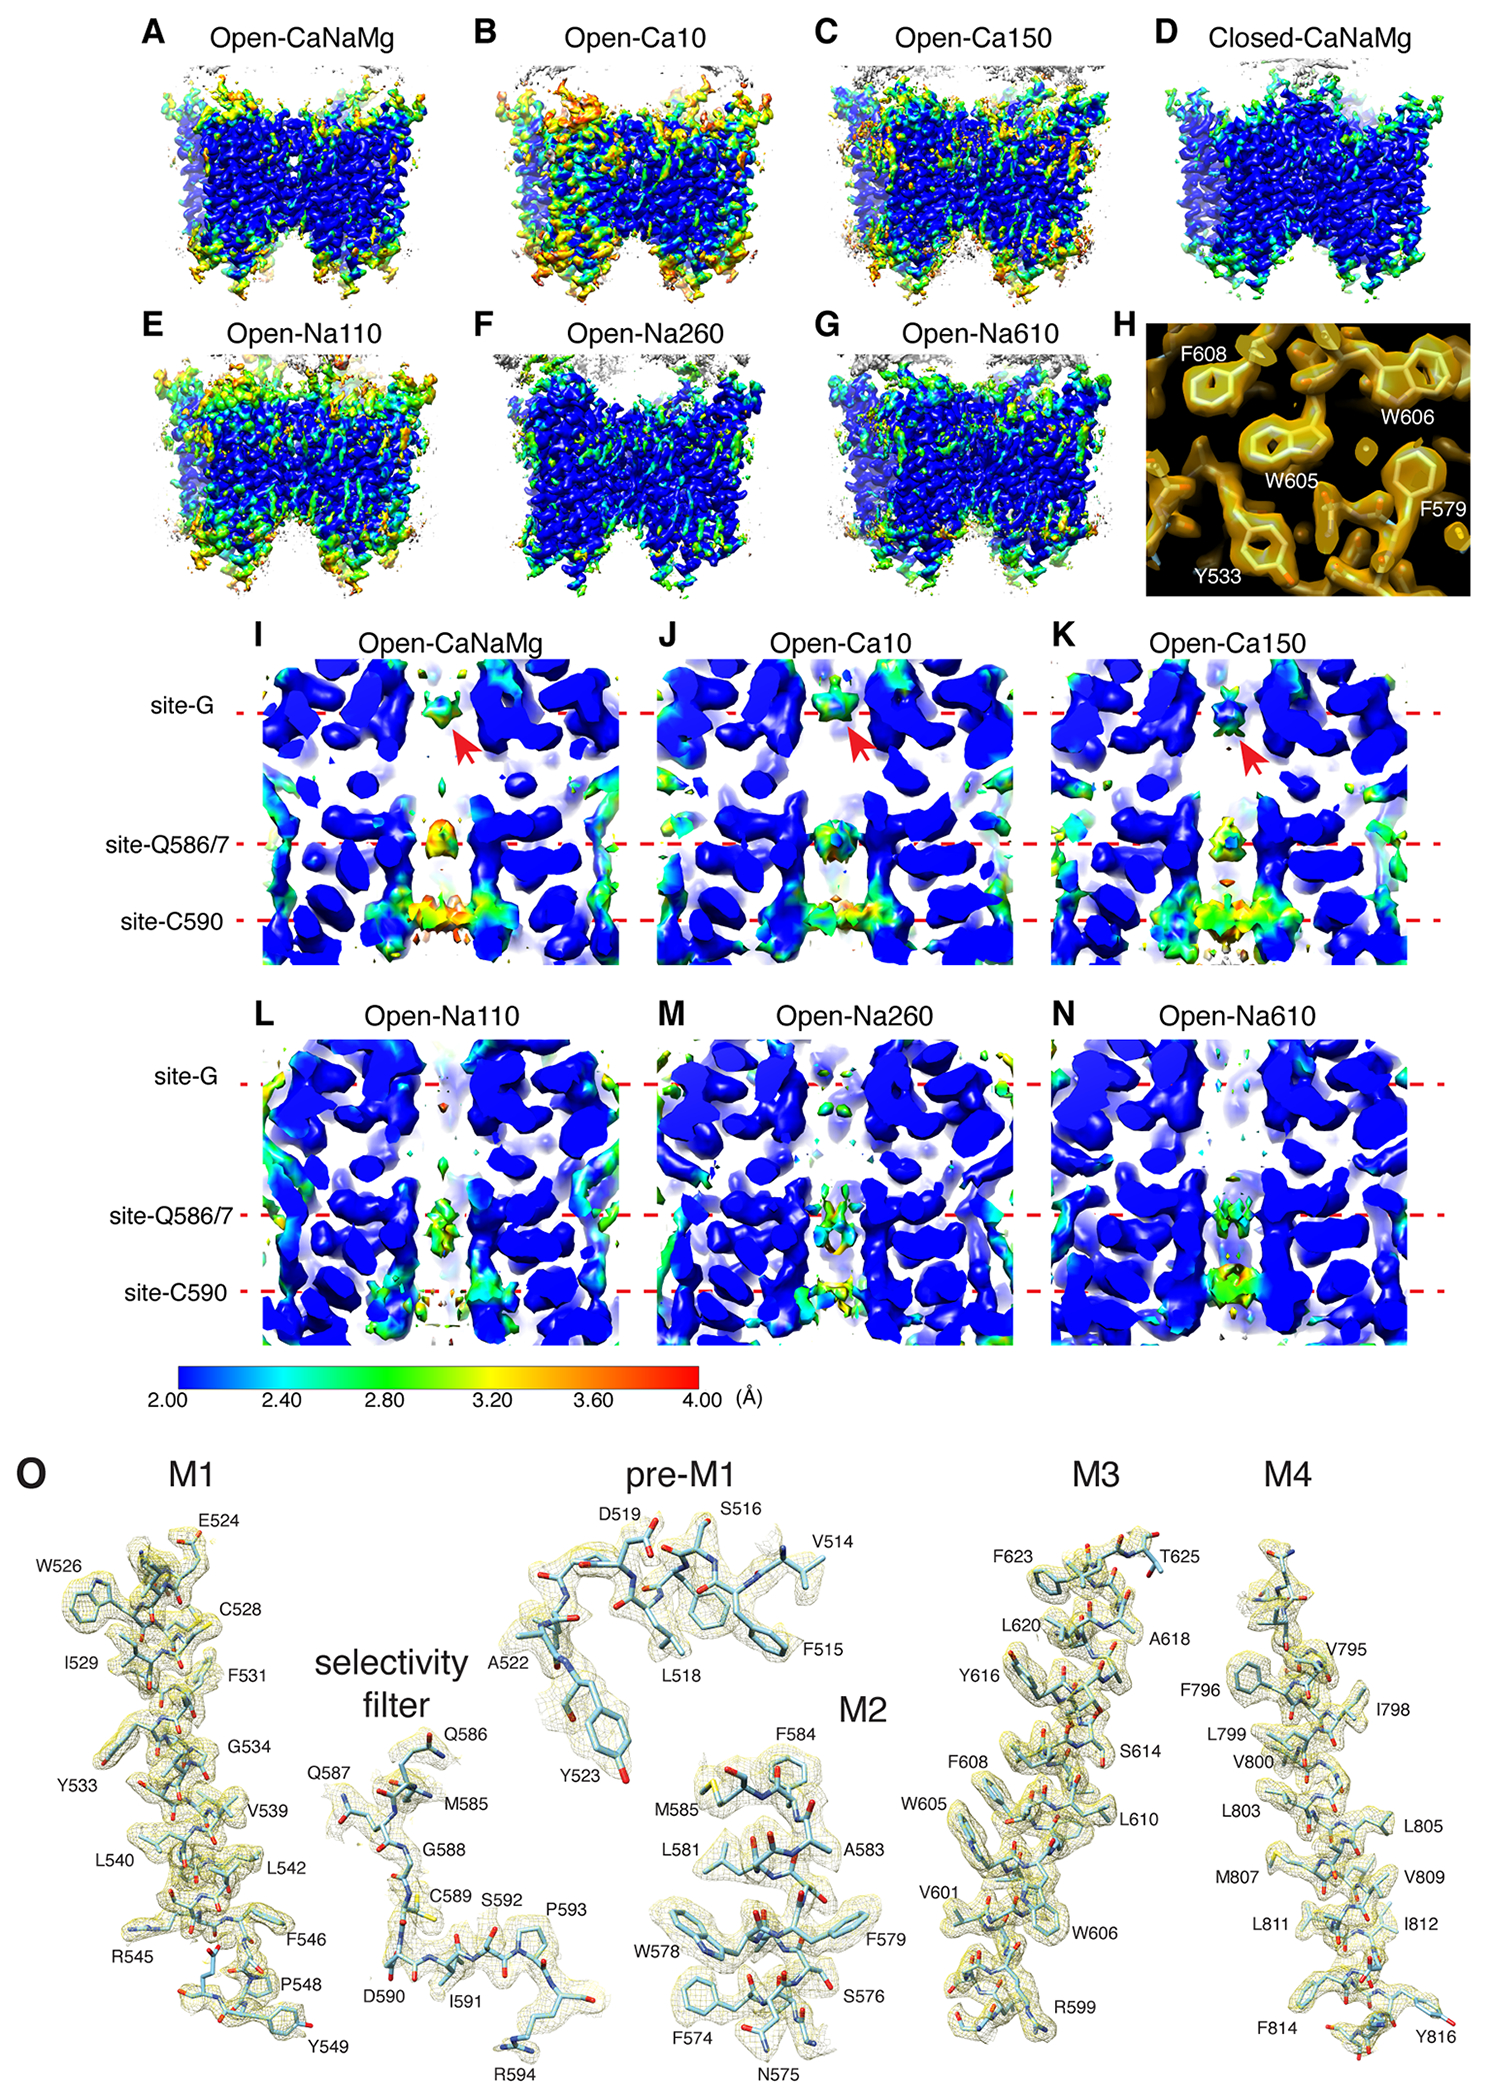
A-G. Local resolution was estimated by ResMap 59, using as input the half maps generated by 3D refinement in Relion. The heatmap for resolution is shown on the bottom right. Side view of each indicated structure. H. Overlay of map and model in a subregion of M1-3 helices. With an optimal threshold, the holes in the aromatic sidechains are discernable. I-N. Cross sections of local resolution heatmaps of the open pores. The arrows in I-K are the Ca2+ density at site-G. Note higher local resolution of the density in 150mM Ca2+ (Open-Ca150) compared to 10mM Ca2+ (Open-Ca10 and Open-CaNaMg), consistent with more binding at higher concentration. Note, the maps displayed are half-maps that are unfiltered/unsharpened, and thus the resolution appear lower than the full-maps displayed in other figures. O. Representative overlay of map and model in the TMD. Open-Na260 is shown. Others were at similar quality. Also see Extended Data Fig. 5-6.