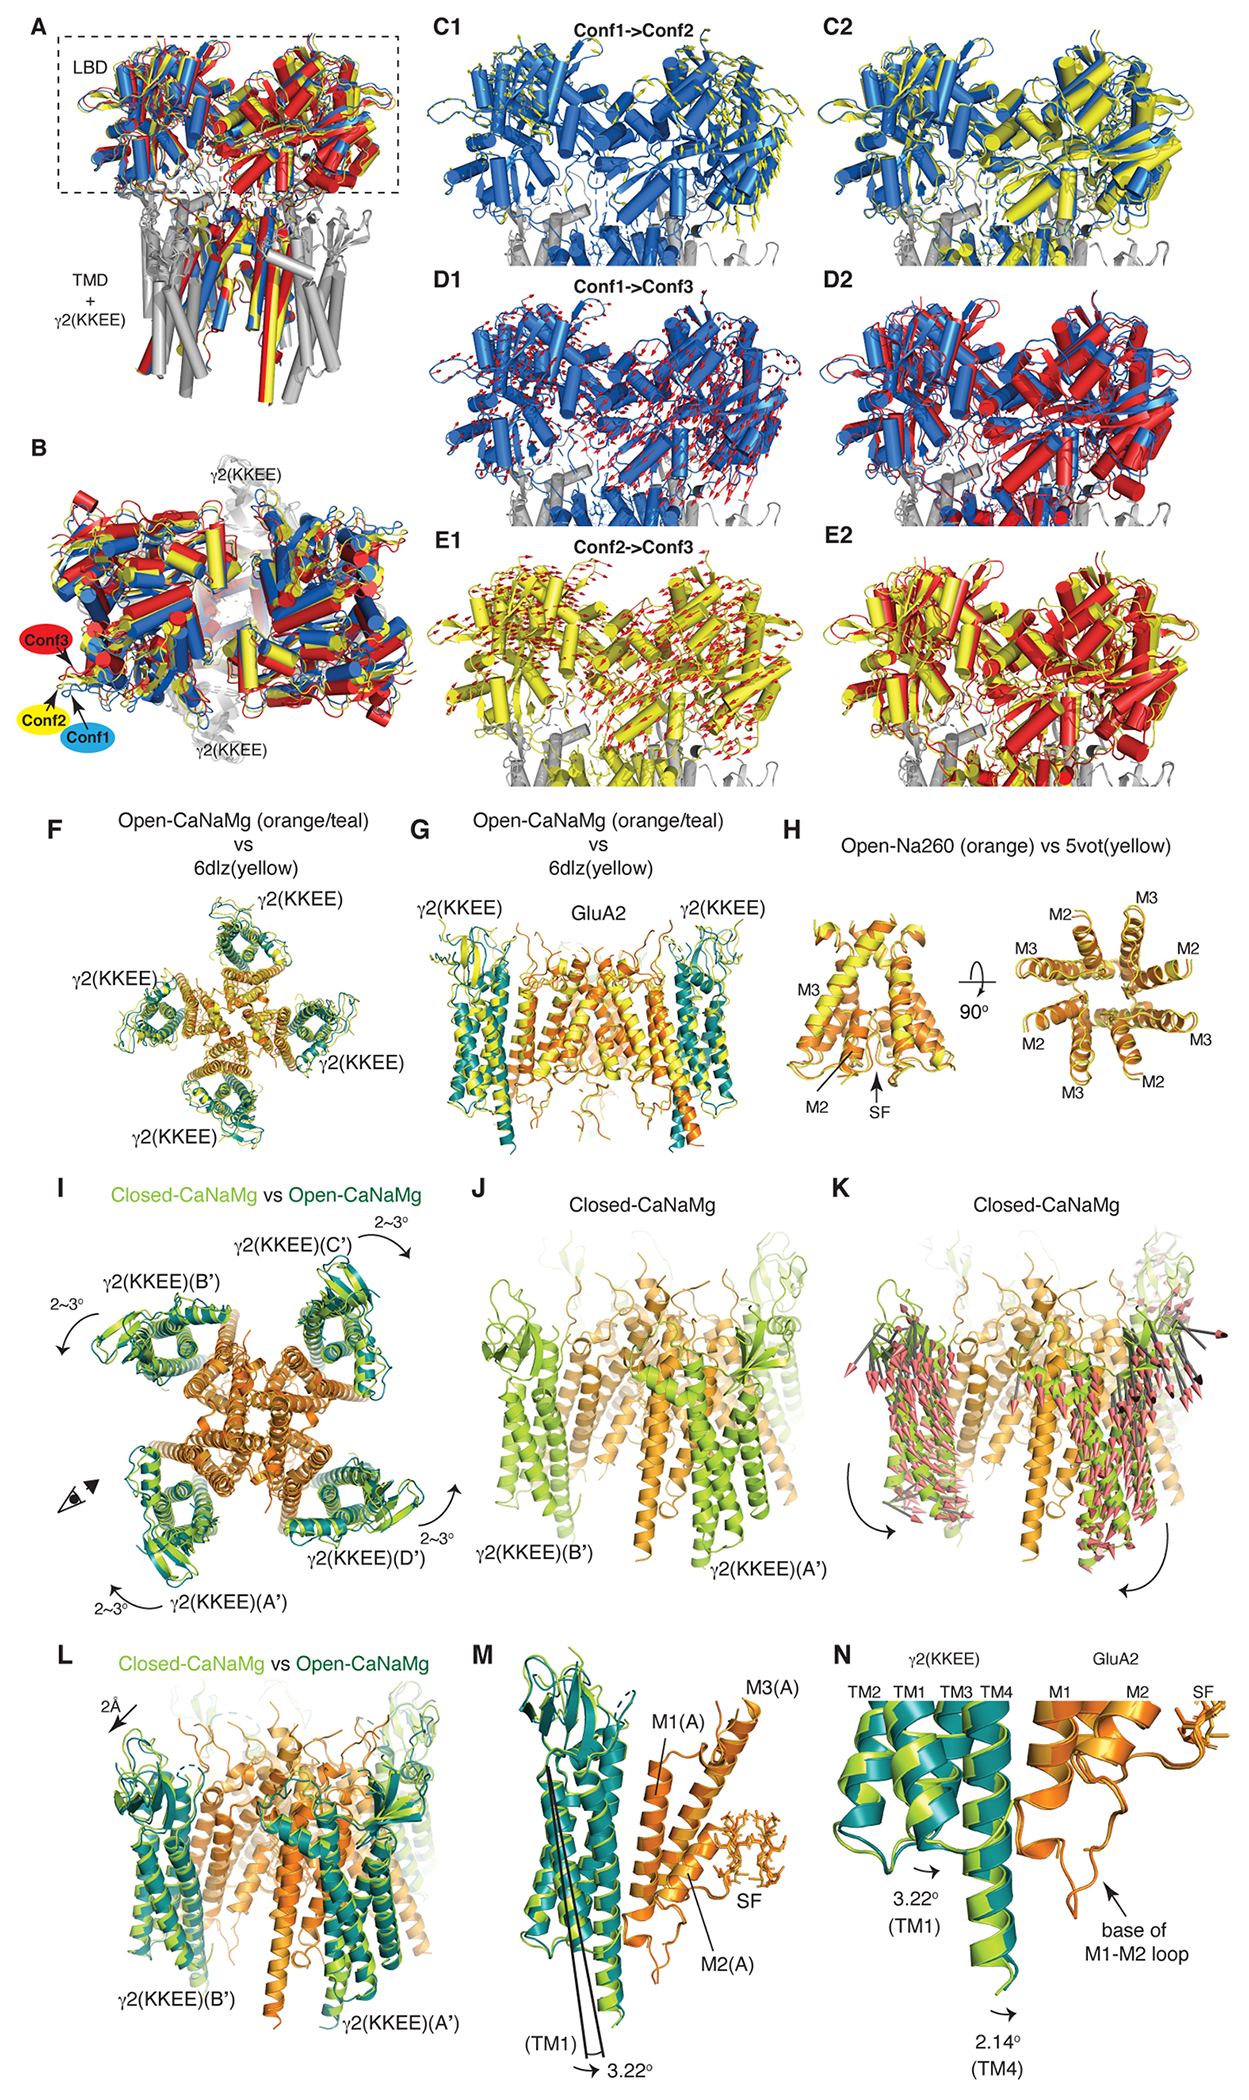
Extended Data Fig. 5. Global structures of the A2iQ/γ2(KKEE).

A-E. Conformational heterogeneity of the LBD gating ring in Open-Na260. A. LBD-TMD sectors were reconstructed from particles that produced LBD Conf1, Conf2, and Conf3. The LBD-TMD were aligned and superimposed using the cytoplasmic half of the SF. The TMD and γ2(KKEE) are nearly perfectly aligned as expected; there was no obvious global conformational heterogeneity of the TMD and γ2(KKEE). Blue=Conf1, Yellow=Conf2, and Red=Conf3. The rectangle indicates the regions that are highlighted in panels C-E. B. The LBD gating ring of the aligned and superimposed structure shown in panel A is viewed from above. The helices of the LBDs do not superimpose. C. Conformational transition from Conf1 to Conf2. The Conf1 conformation is shown with the mode vectors (yellow arrows) that schematically represent the displacements of the Cα during the conformational transition from Conf1 to Conf2 (panel C1). The lengths of the vectors are increased by 50% than actual displacements for clarity. The Conf1 and Conf2 conformations are superimposed in the same view as in panel C1. D and E. The transition from Conf1 to Conf3 (panels D1 and D2) and from Conf2 to Conf3 (panels E1 and E2) are shown as in panel C. F-N. Global architecture of A2iQ/γ-2(KKEE). F and G. The atomic model of Open-CaNaMg at 2.4Å resolution, where γ2(KKEE) in teal and GluA2 in orange, is superimposed to the A2iQ/γ2 wild-type complex in yellow (PDB:6dlz, 3.9Å resolution). The root mean square deviation (RMSD) of the Cα is 1.909Å. Top view (A) and cross section side view (B). H. The pore (i.e., M2, SF, and M3) of Open-Na260 at 2.3Å resolution is superimposed to the A2iQ/γ2 wild-type complex in yellow (PDB:5vot, 4.9Å resolution). The RMSD of Cα of the M3 in B/D subunit pairs is 0.642Å. I. Conformational difference between Closed-CaNaMg and Open-CaNaMg. The two structures were aligned at the cytoplasmic half of M3 (residue 597-610) at RMSD=0.3Å. GluA2 are colored in ogrange and light orange in Open-CaNaMg and Closed-CaNaMg, respectively. The four γ2(KKEE)s of Open-CaNaMg are colored in teal, while in Closed-CaNaMg they are in light green. The position of the γ2(KKEE)s relative to the GluA2 are indicated by the A’-D’ labels, as defined in Fig1B. The γ2(KKEE)s undergo counter rotations of 2-3° within the A’/B’ and C’/D’ pairs (curved arrows). The eye and arrow indicate the viewpoint of the structures in J-K. J. Closed-CaNaMg without the mode vector arrows. K. Closed-CaNaMg with the mode vector arrows that describe the directions and magnitudes of displacement of the Cα between Closed-CaNaMg and Open-CaNaMg. Arrows are shown for all motion greater than 0.5Å. The counter rotation of the γ2(KKEE)s in the A’/B’ pairs are shown. L. Superposition of the Open-CaNaMg and Closed-CaNaMg shows the ~2Å outward motion of the extracellular domain of the TARPs. M and N. The activation is also accompanied by a 2-3° tilt of the TARPs, which brings close the cytoplasmic extension of TM4 of γ2(KKEE) to the base of M1-M2 loop of GluA2. In the magnified view (I), the difference in the tilt angle in TM1 and TM4 of γ2(KKEE) is shown.
