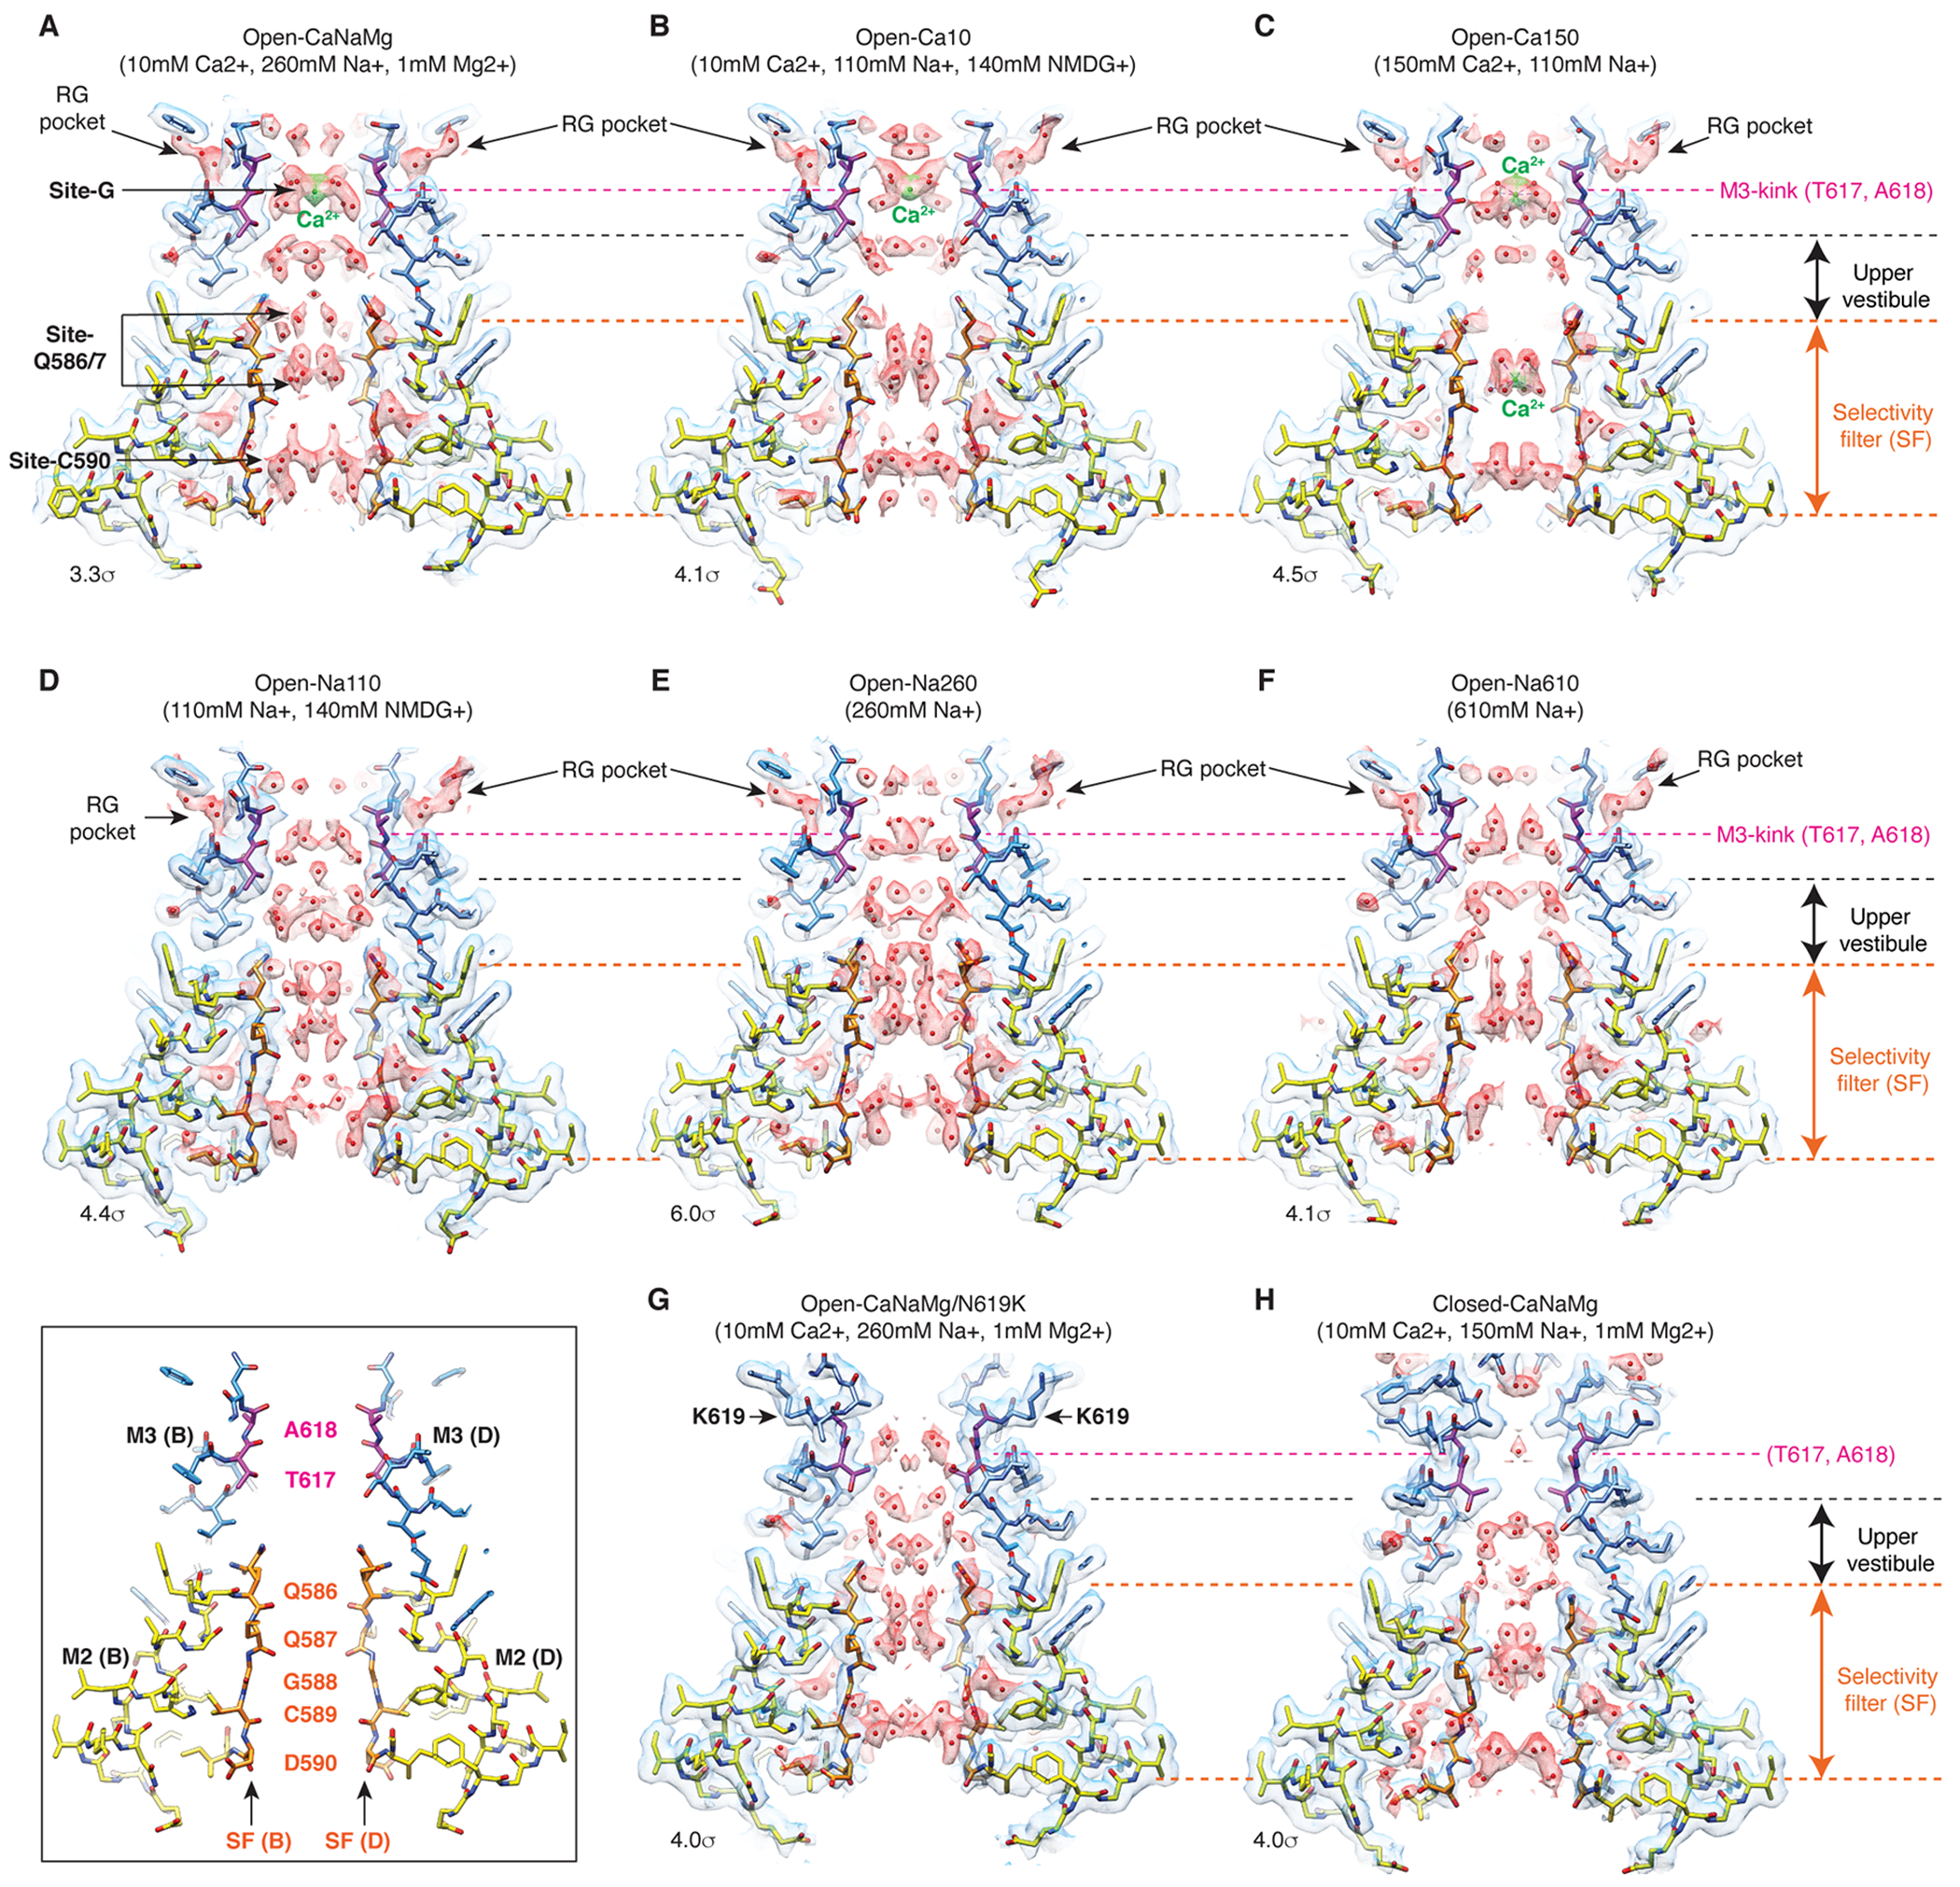
Extended Data Fig. 7. Comparison of cryo-EM maps and models in the pores in the cross-section containing the B/D subunits.

Cross sections containing B/D subunits of the pores of Open-CaNaMg (A), Open-Ca10 (B), Open-Ca150 (C), Open-Na110 (D), Open-Na260 (E), Open-Na610 (F), Open-CaNaMg/N619K (G), and Closed-CaNaMg (H) are displayed. The cryo-EM density map (mesh) and the atomic model are superimposed. The cryo-EM maps are displayed using the indicated sigma values. Putative water and calcium ion are in red and green spheres, respectively. The atomic models of the polypeptides of M2, SF, and M3 are shown in yellow, orange, and sky blue, where elements are colored according to oxygen=red, nitrogen=blue, and sulfate=yellow. Resides that define the gate in the M3 of each structure are colored magenta. The left bottom inset shows the locations of the key residues in the wild type open pore. Each view is the orthogonal to the corresponding structure shown in the previous figure. C2 maps are displayed (also see Table1).
