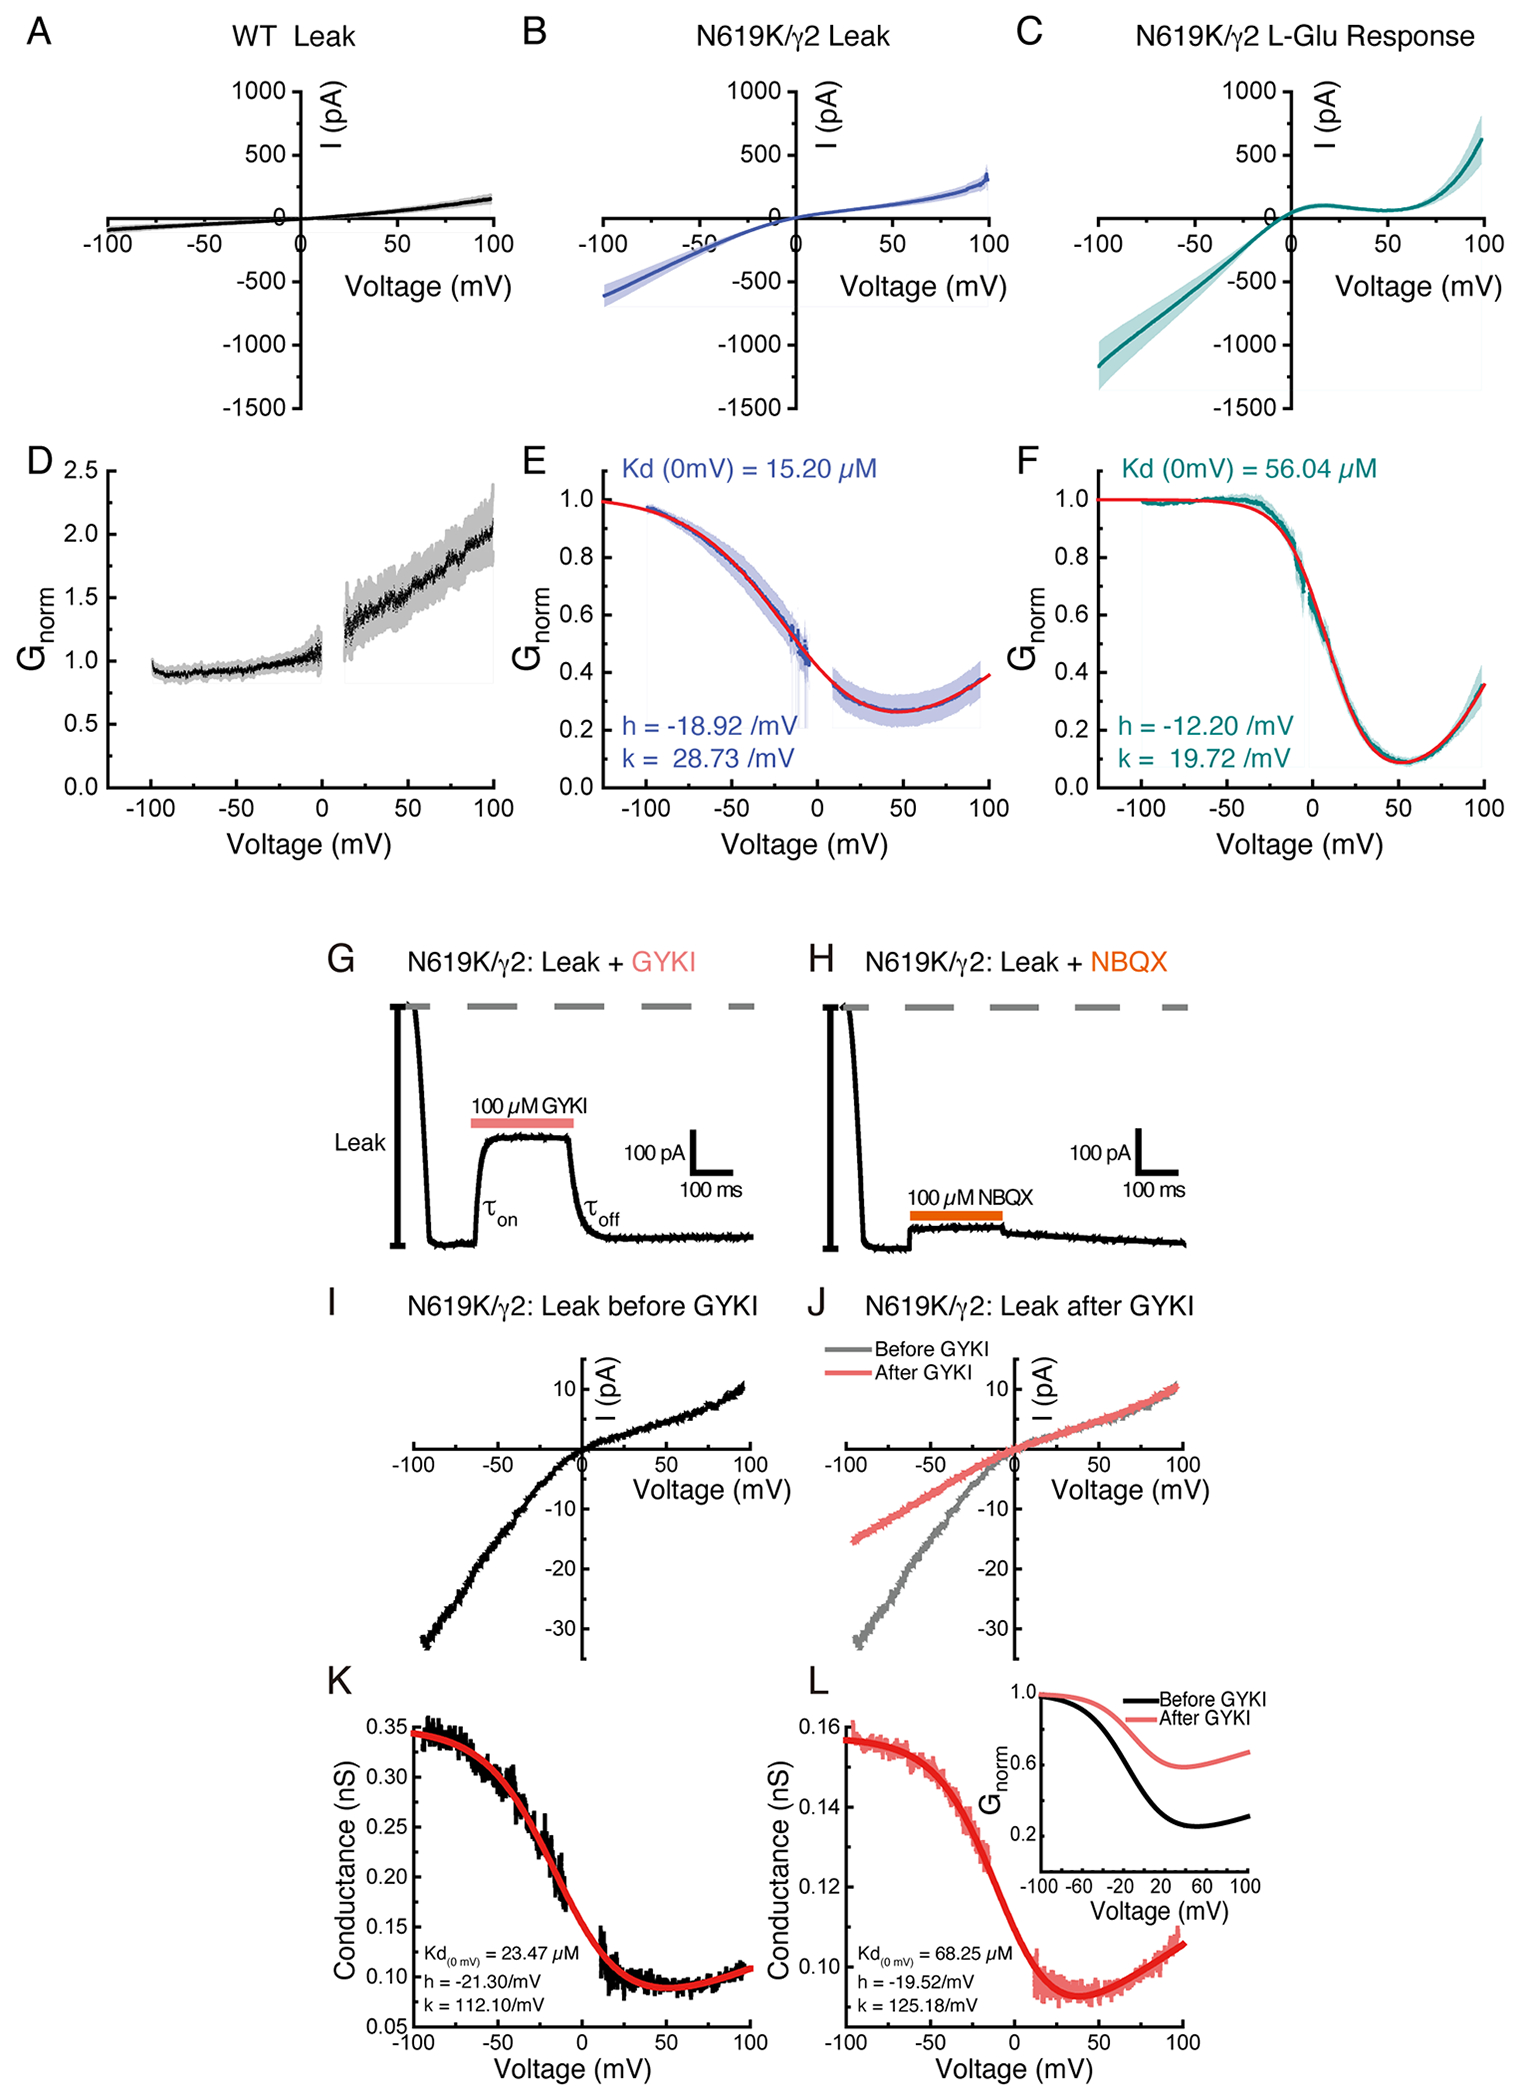
Extended Data Fig. 10. Characterization of A2iQ(N619K)/γ2 complex.

A-C. Averaged ramp currents (I-V) recorded in excised patches expressing wild-type A2iQ/γ2 prior to agonist stimulation (A, black), N619K/γ2 leak (B, blue) and agonist-evoked (C, dark cyan) responses using an internal patch solution containing 30 μM spermine. Dim colours show the SEM. The I-V plots both show bi-rectifying I-V relationships demonstrating that cytoplasmic spermine blocks the leak (B) and agonist-gated state (C) of the mutant A2iQ(N619K)/γ2 receptors. Data are presented as mean values ± SEM. (also see Supplementary Table 4). D-F. Conductance-voltage (G-V) plots converted from A-C for wild-type leak (D, black), N619K/γ2 leak (E, blue) and agonist-evoked (F, dark cyan) responses. In dim colours it is shown the SEM of the averaged conductance curves, respectively. Red lines in E and F are the fit for the G-V relationships for leak and agonist-evoked responses of N619K/γ2 receptors, respectively, using the single permeant blocker model (eq.1). Data are presented as mean values ± SEM. (Also see Supplementary Table 7) G and H. Fast jumps experiments comparing the ability of the AMPAR negative allosteric modulator, GYKI 52466 (100 μM) (G, Patch # 221129p3) or the competitive antagonist, NBQX (100 μM) (H, Patch # 221129p3) to block the leak currents mediated by N619K/γ2 receptors. The onset and off kinetics of GYKI (G) were estimated as τon = 12.7 ± 0.9 ms (n=10) and τoff = 37.1 ± 3.9 ms (n=10), respectively (also see Supplementary Table 5 and 6). I. I-V plot of the leak current of N619K/γ2 receptors with an internal patch solution containing 30 μM spermine in the absence of agonist. J. Typical I-V plots of leak currents of N619K/γ2 receptors before (grey) and after (pink) applying 100 μM GYKI (Patch # 221201p4), in the absence of agonist and containing 30 μM spermine in the internal solution. K and L. Conductance-voltage (G-V) plots of the leak N619K/γ2 receptors, converted from J (Patch # 221201p4), before (K, black) and after (L, pink) applying 100 μM GYKI. The G-V curves are fit (red in K and L) using a single permeant ion blocker model (eq. 1). L. (inset) Normalized G-V plots before (black) and after (pink) the application of GYKI are superimposed.
