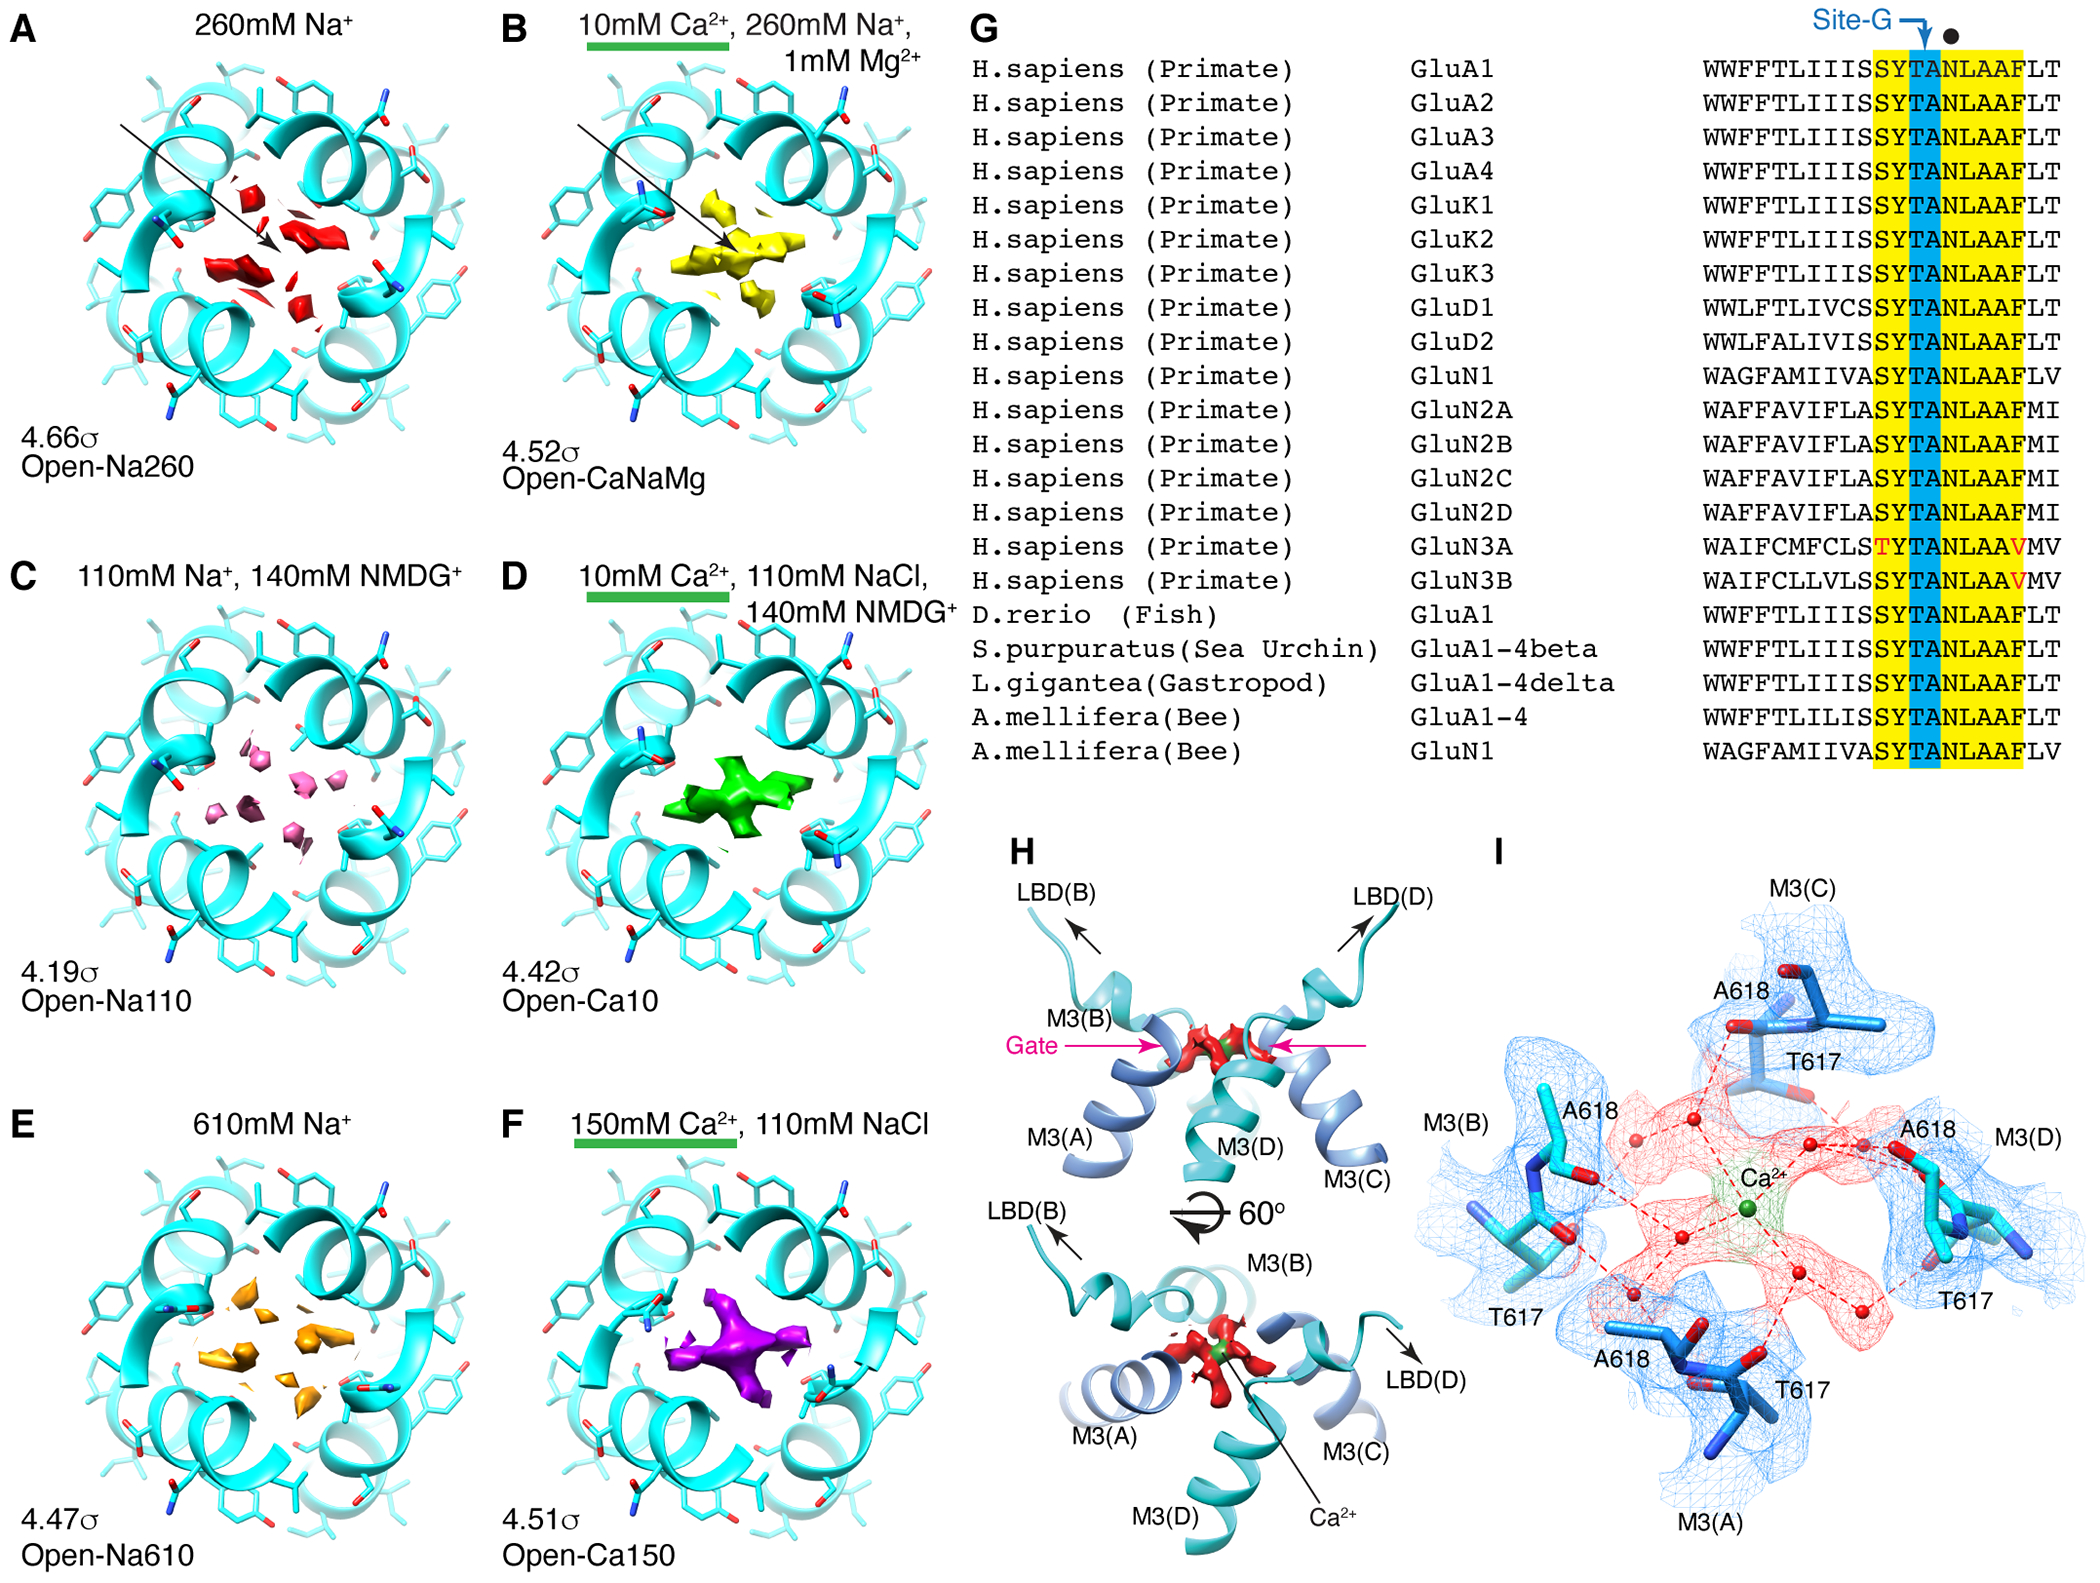
Figure 2. Site-G as a Ca2+ binding site at the gate.

A-F. The top views of site-G in the open gates under different ionic conditions. The M3 helices in cyan. Pore occupying densities are in red (A. Open-Na260), yellow (B. Open-CaNaMg), pink (C. Open-Na110), green (D. Open-Ca10), orange (E. Open-Na610), and purple (F. Open-Ca150). The sigma values indicate display thresholds. Overall density occupying site-G is stronger when Ca2+ is present. For example, compare the arrows in A and B. See Extended Data Fig. 6-7 for sideview. G. Alignment spanning the SYTANLAAF motif. Atypical residue in red. The non-vertebrate subunit nomenclature follows reference49. H. Side (top) and diagonal (bottom) view of site-G in Open-CaNaMg. The M3 helices in cyan and blue. The EM density map of putative water and putative Ca2+ are in red and green, respectively. I. T617 and A618 make site-G. The atomic model and density map are superimposed. The dashed red lines are the putative hydrogen bonds and ion-water interactions.
