
Figure 5. N619K mutation promotes opening and alters kinetic properties of the ion channel.
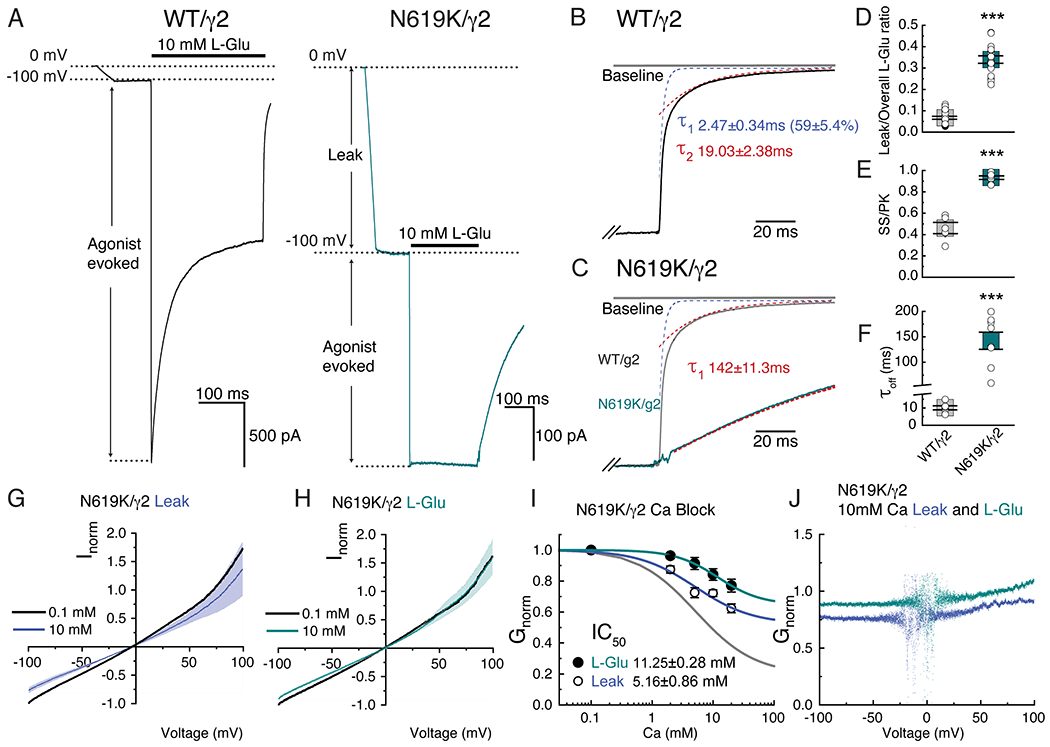
A. Example traces of leak and agonist-evoked responses of WT (in black, Patch # 200121p2) and mutant N619K (in cyan, Patch # 221201p5) receptors at −100 mV. Note the substantial leak current in the mutant. B. Example of deactivation kinetics of WT (black trace) fit by bi-exponential function (blue and red dashed lines are the τ1 and τ2 component, respectively). C. Example of deactivation kinetics of N619K superimposed with the WT example from panel B. N619K deactivation kinetics was fit by mono-exponential function. Trace response (cyan) and model fit (red). D-F. Scatter plots showing all data points from each group. Average represented with grey and cyan squares with SEM. D. Ratio of leak over overall evoked currents (ratio leak current of overall current WT: 0.07 ± 0.01, n=6; N619K: 0.34 ±0.02, n=8; two-sided Mann-Whitney test, p-value <0.001). E. Steady state current over peak current ratio (WT: 0.46 ± 0.05, n=8; N619K=0.93±0.02, n=8; unpaired two-sided t-test with Welch correction, p-value <0.001). F. Deactivation kinetics measured using the offset kinetics. Off kinetics in WT and N619K were fit to bi-exponential (τ1 and τ2) and mono-exponential functions, respectively (WT: 10.10 ± 1.18, n=6;N619K: 142.00 ±11.30, n=8; unpaired two-sided t-test with Welch correction, p-value <0.001). Also see in Supplementary Table 4. G and H. Normalized I-V currents recorded in N619K/γ2 mutant at holding potential ganging from −100 mV to +100mV. Black; average response from all recordings in 0.1 mM Ca solution. Blue; average responses in 10 mM Ca2+ for leak current (n=6). Cyan; 10 mM glutamate and 100μM CTZ evoked responses (n=6). SEM of leak and evoked currents in dim colors. I. Inhibition plots of external Ca2+ block for leak (open circles, n=6) and agonist-evoked (filled circles, n=6) responses in N619K receptors at −100 mV. Data are presented as mean values ± SEM. (Also see in supplementary table 3) J. Conductance-voltage plots of block by 10 mM external Ca2+ for the agonist-evoked curve (cyan) and the leak curve (blue).